Three-Dimensional Prints with Blender and OpenStreetMap
Table of Contents
Summary⌗
I used blender-osm and Freestyle to render three-dimensional geodata from OpenStreetMap to a pen plotter.
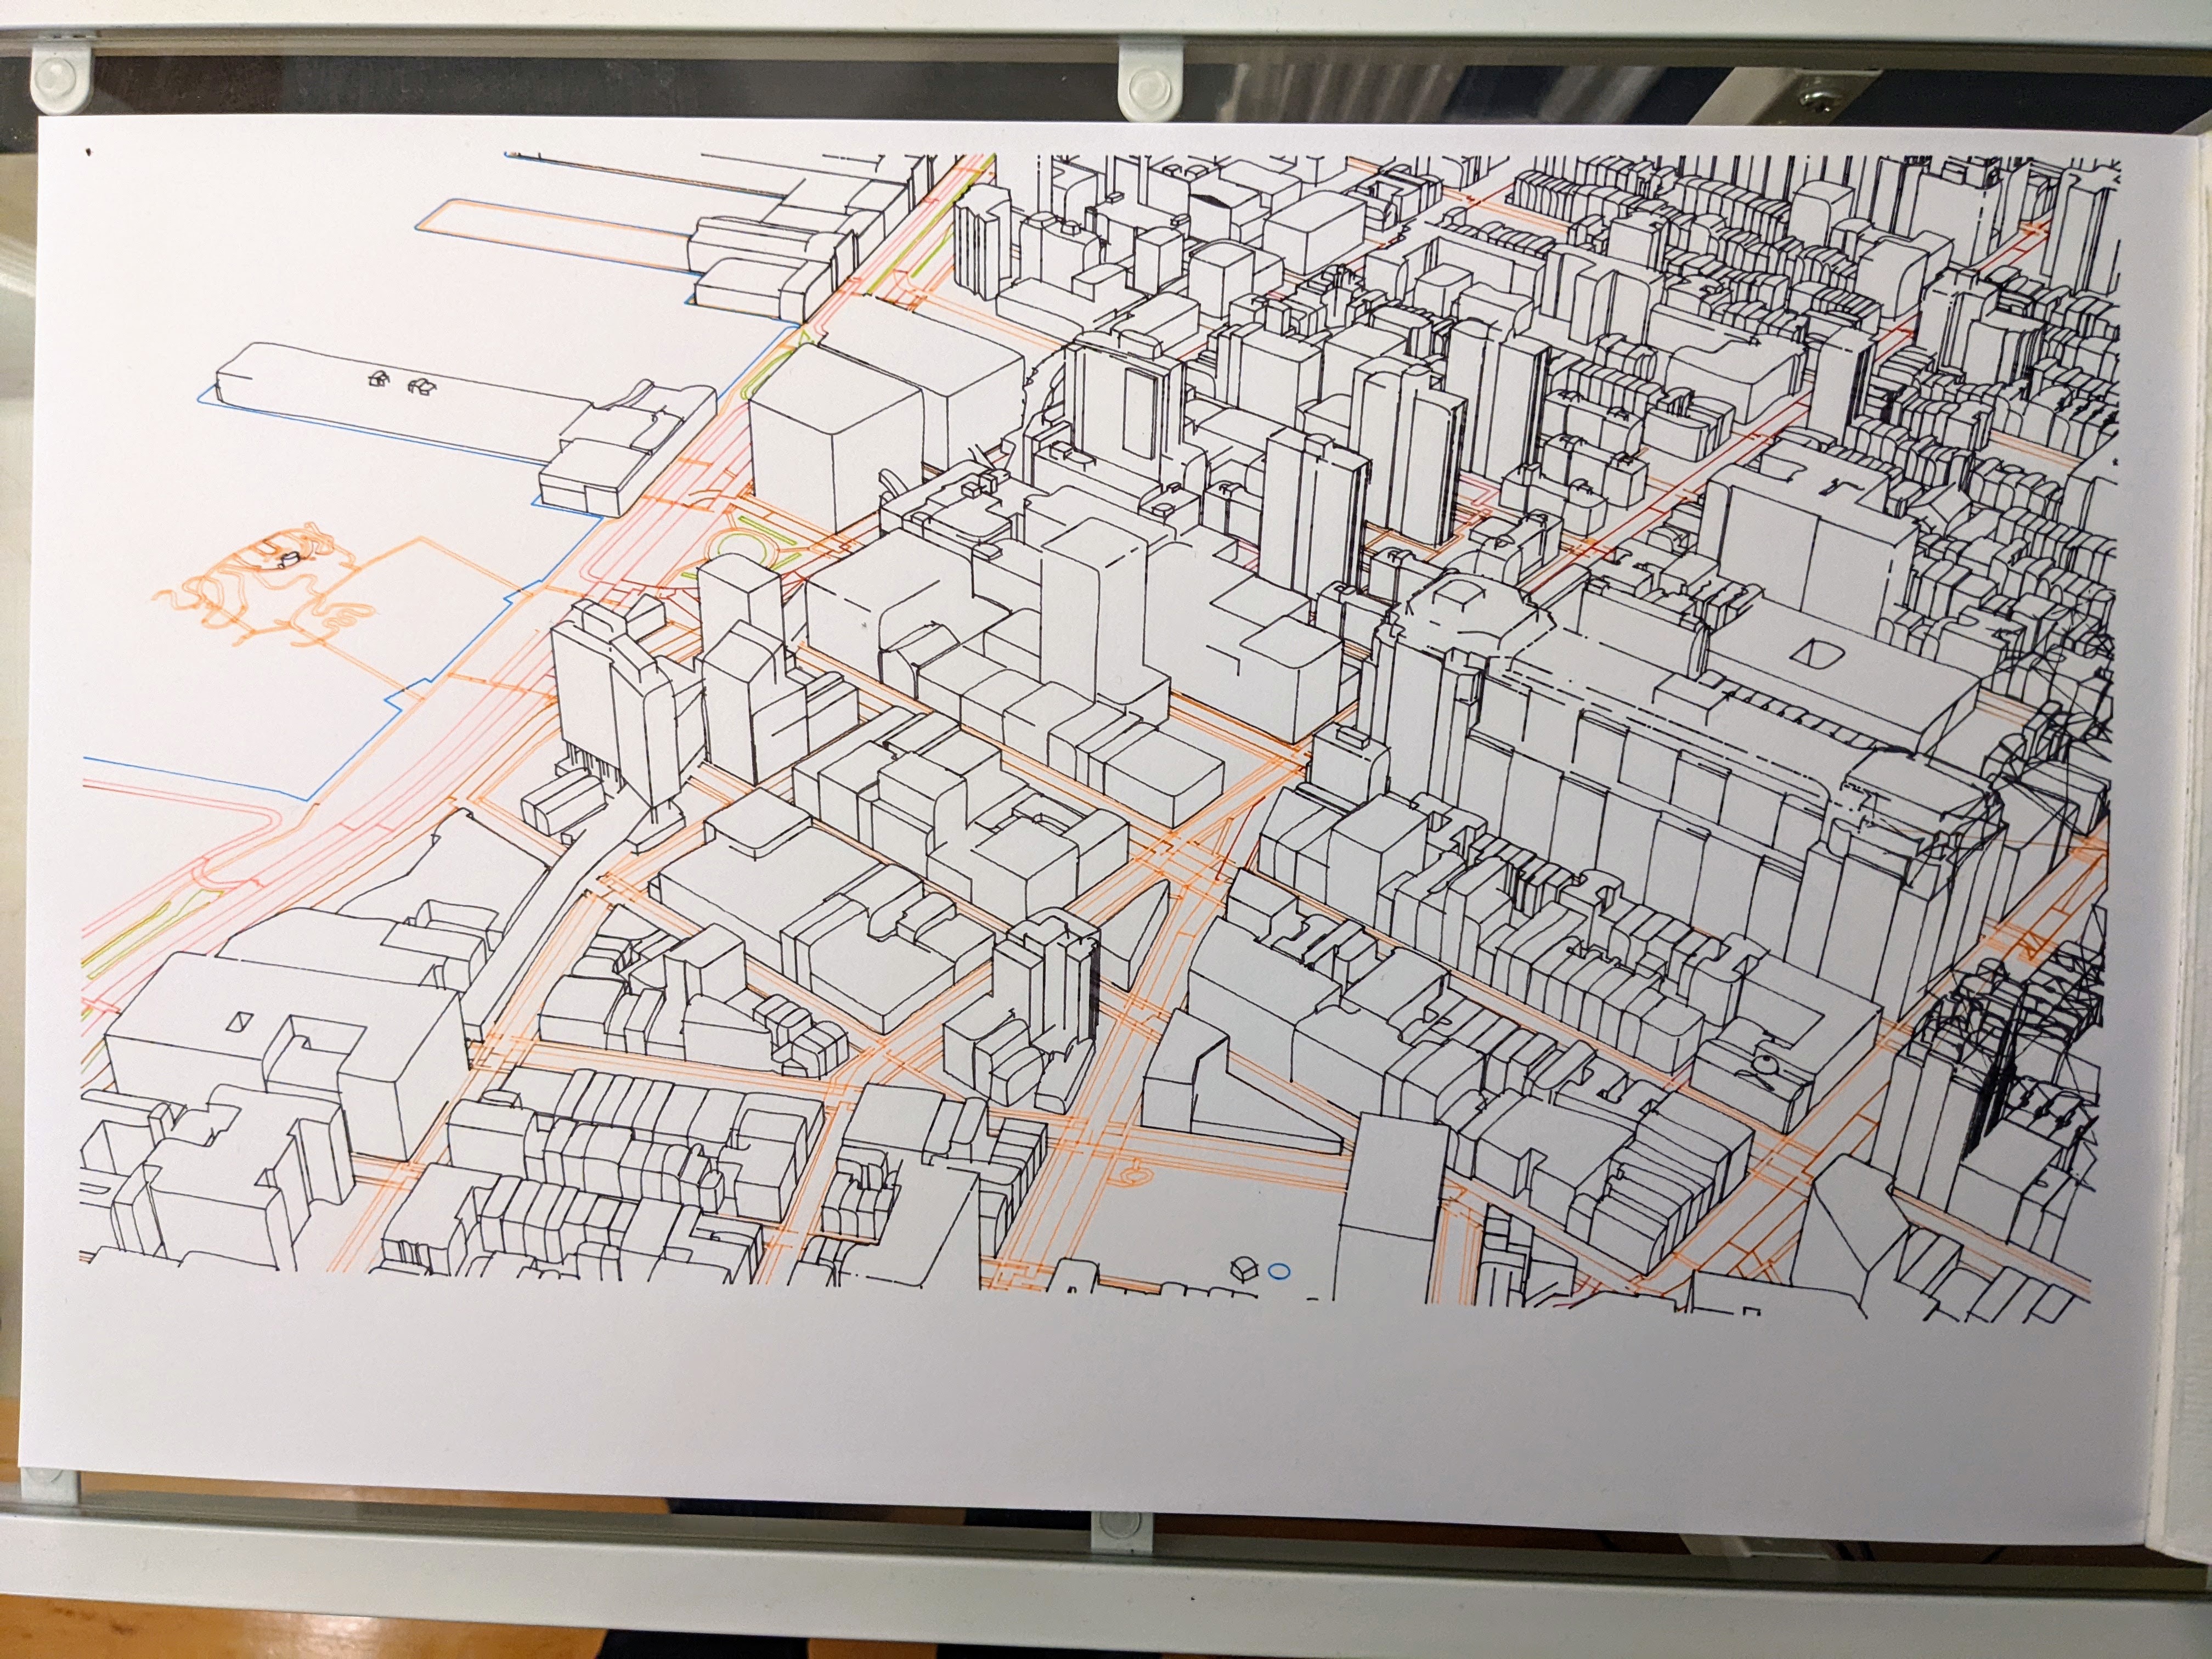
Here is the finished product, a 11in x 17in print on vellum. (Click through for high resolution.)
Here is an overview of the data pipeline I used to generate this print:
┌─────────────┐
│OpenStreetMap│
└┬────────────┘
 │
┌▼──────────┐
│blender-osm│
└┬──────────┘
 │
┌▼──────┐
│Blender│
└┬──────┘
 │
┌▼─────────────────────┐
│Freestyle SVG Exporter│
└┬─────────────────────┘
 │
┌▼──────┐
│AxiDraw│
└───────┘
OpenStreetMap⌗
OpenStreetMap is a Wikipedia-style repository of map data. I have used it before to download and print map data with a pen plotter. It contains high-quality, free, volunteered and compiled 2D and 3D geodata about the real world.
blender-osm⌗
blender-osm is a plugin written by prochitecture which imports geodata from OSM into Blender, a free 3D computer graphics software suite.
After installing the plugin and using it to create a new document, blender-osm links the user to an area selection website which makes it simple to select an area of the map to download.
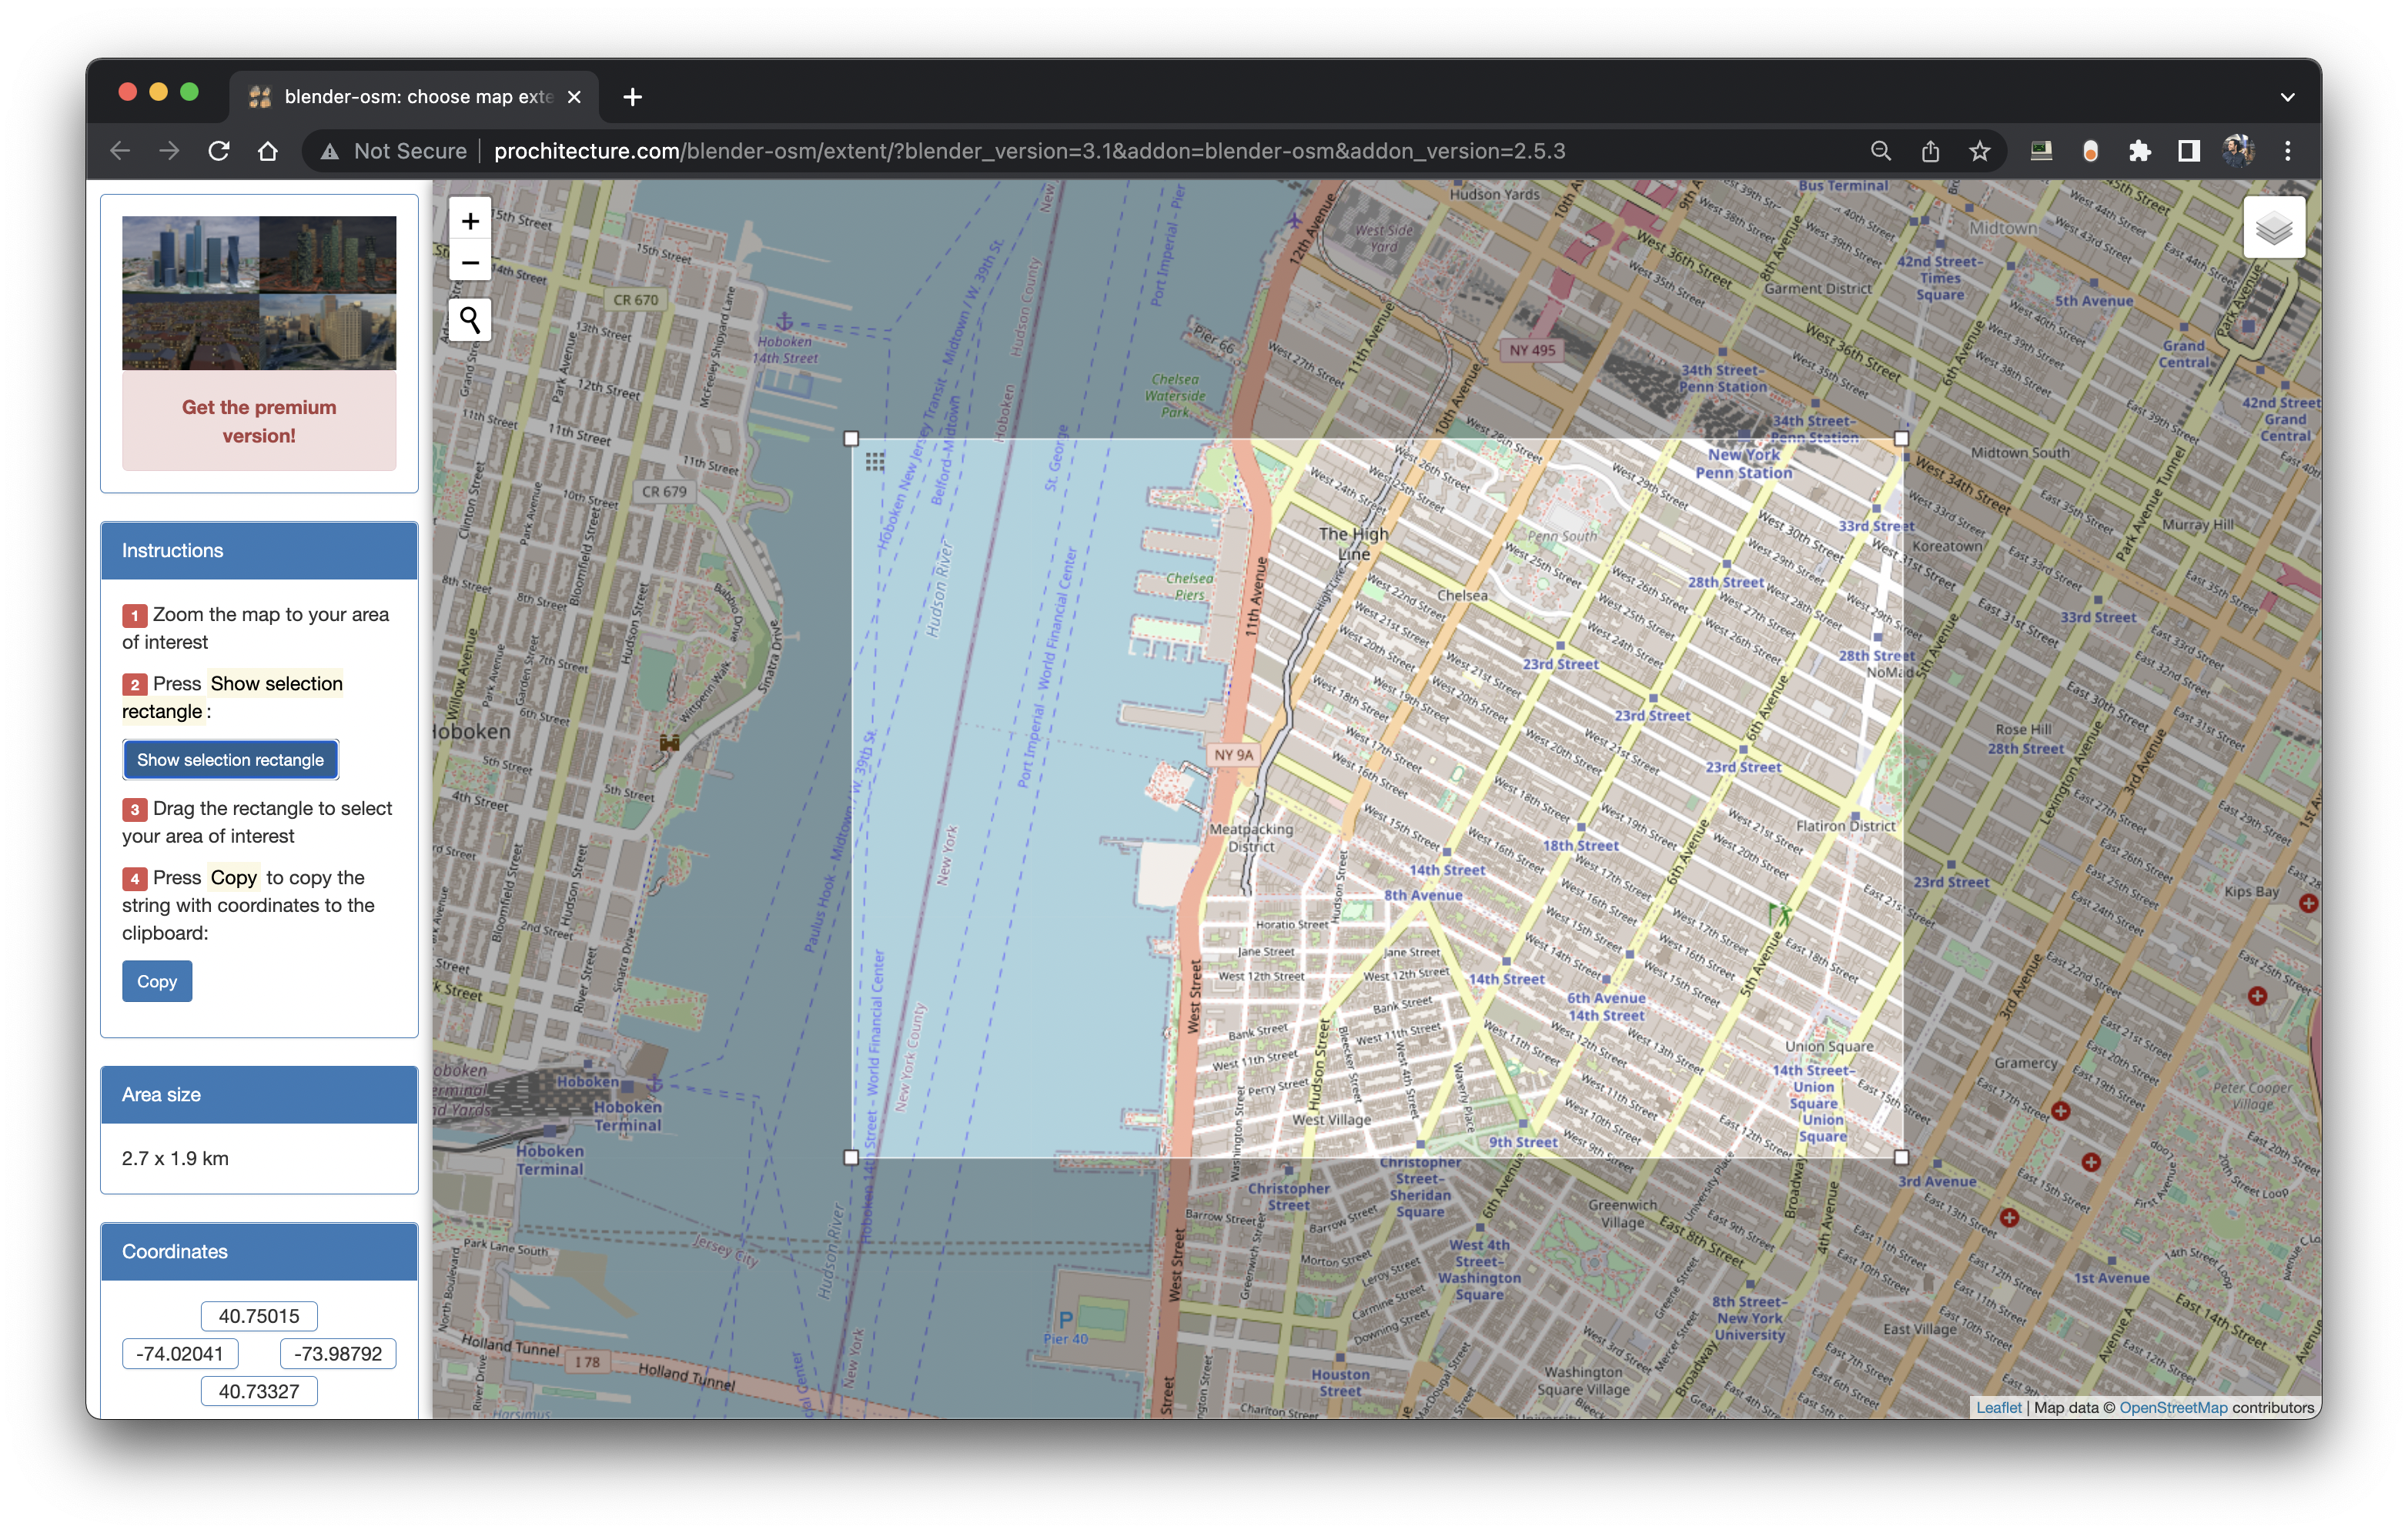
We can copy/paste the lat/long area selection (in this case, a string like -74.02041,40.73327,-73.98792,40.75015) into the blender-osm interface and select which map layers to import (buildings, forests, water, etc.)
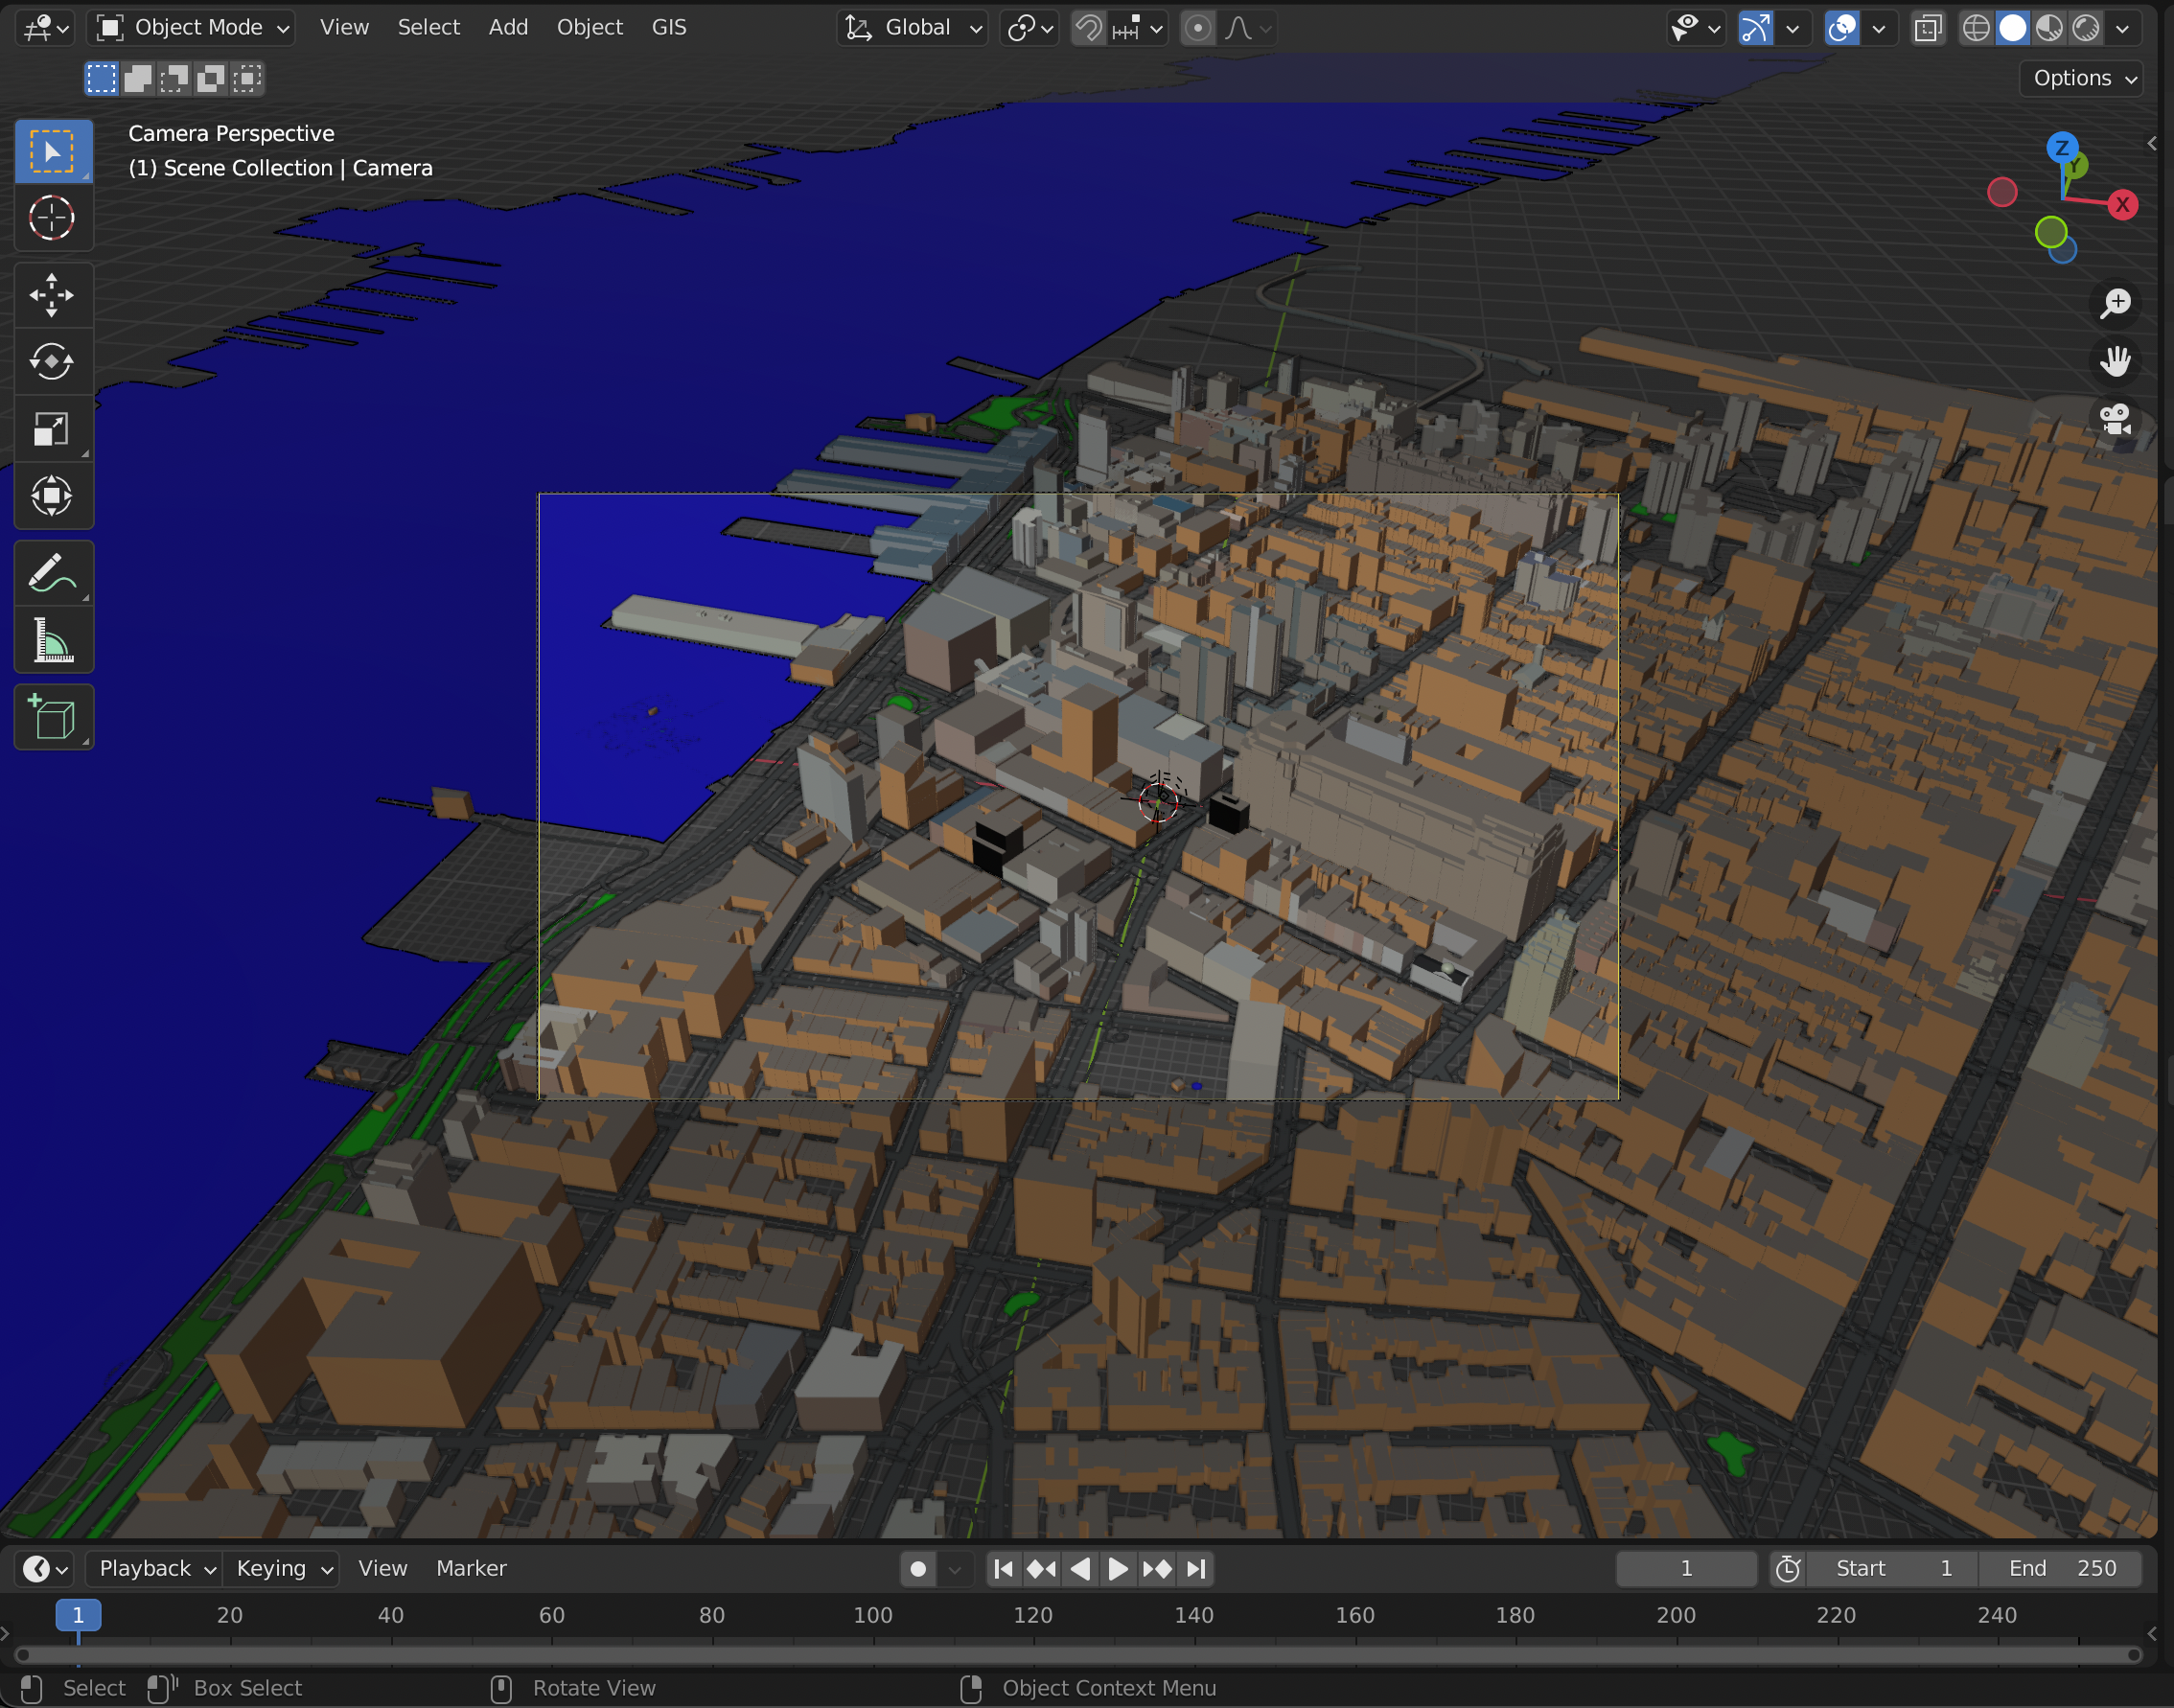
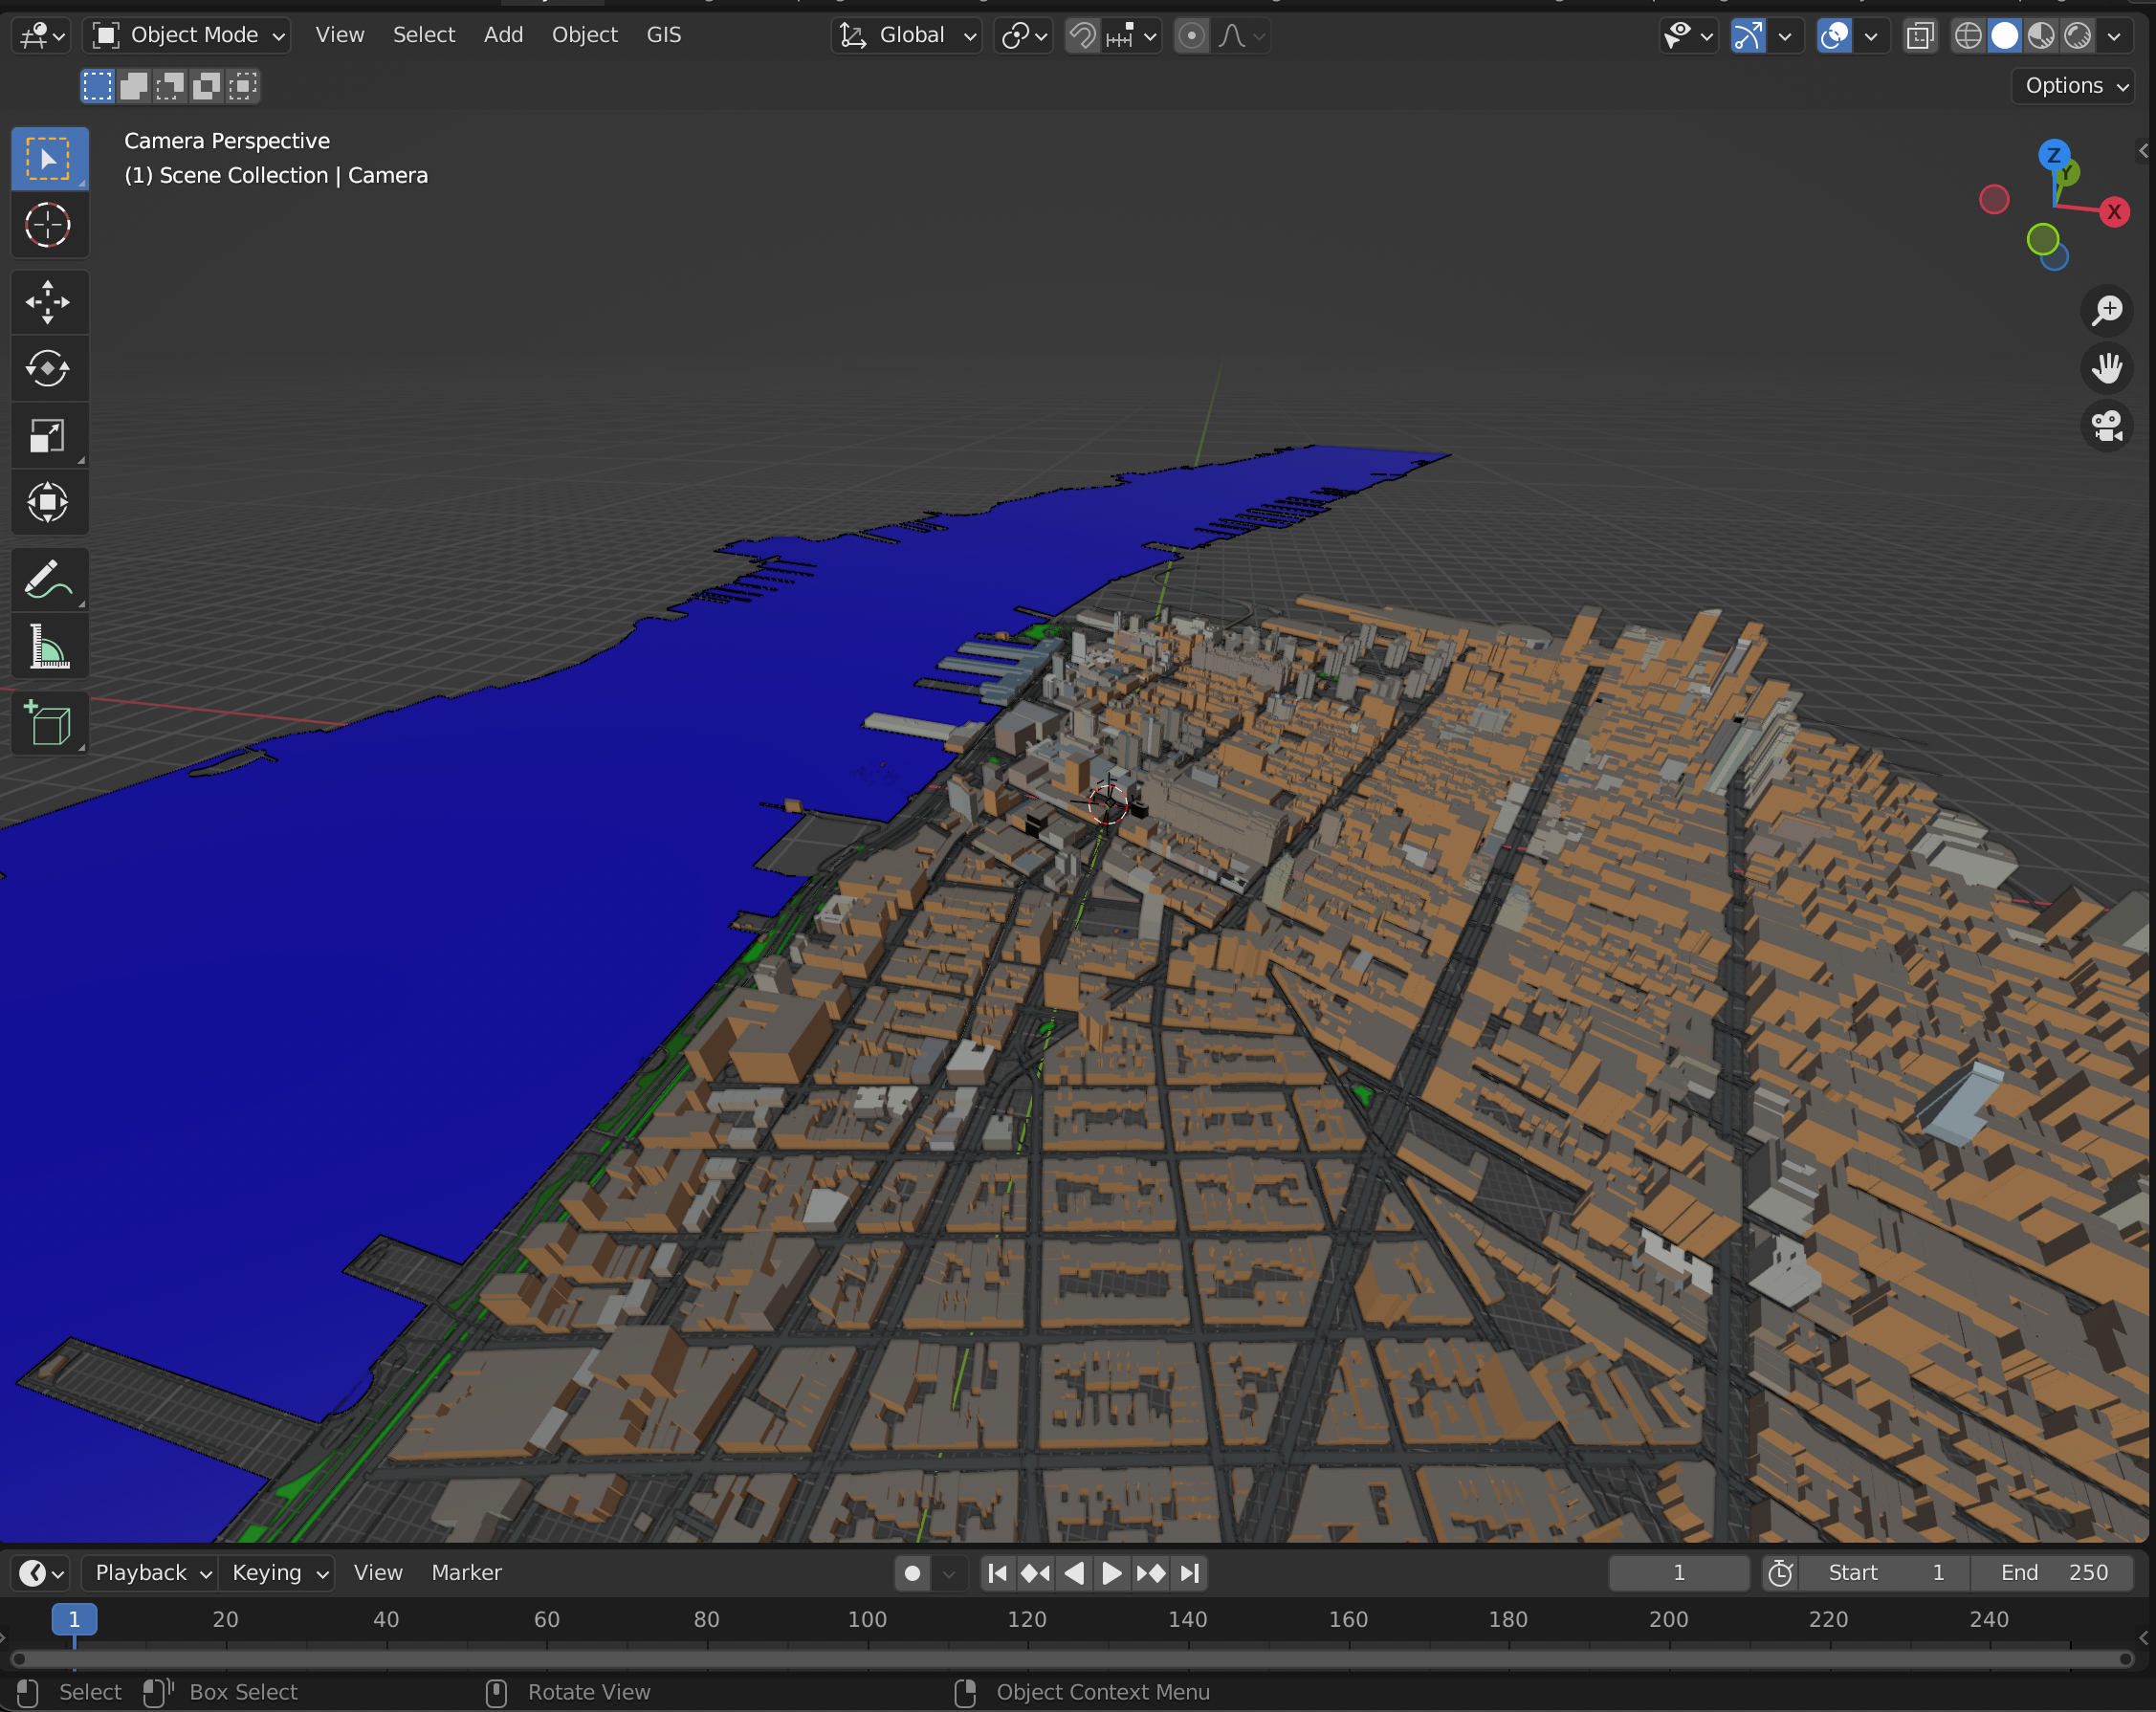
Blender⌗
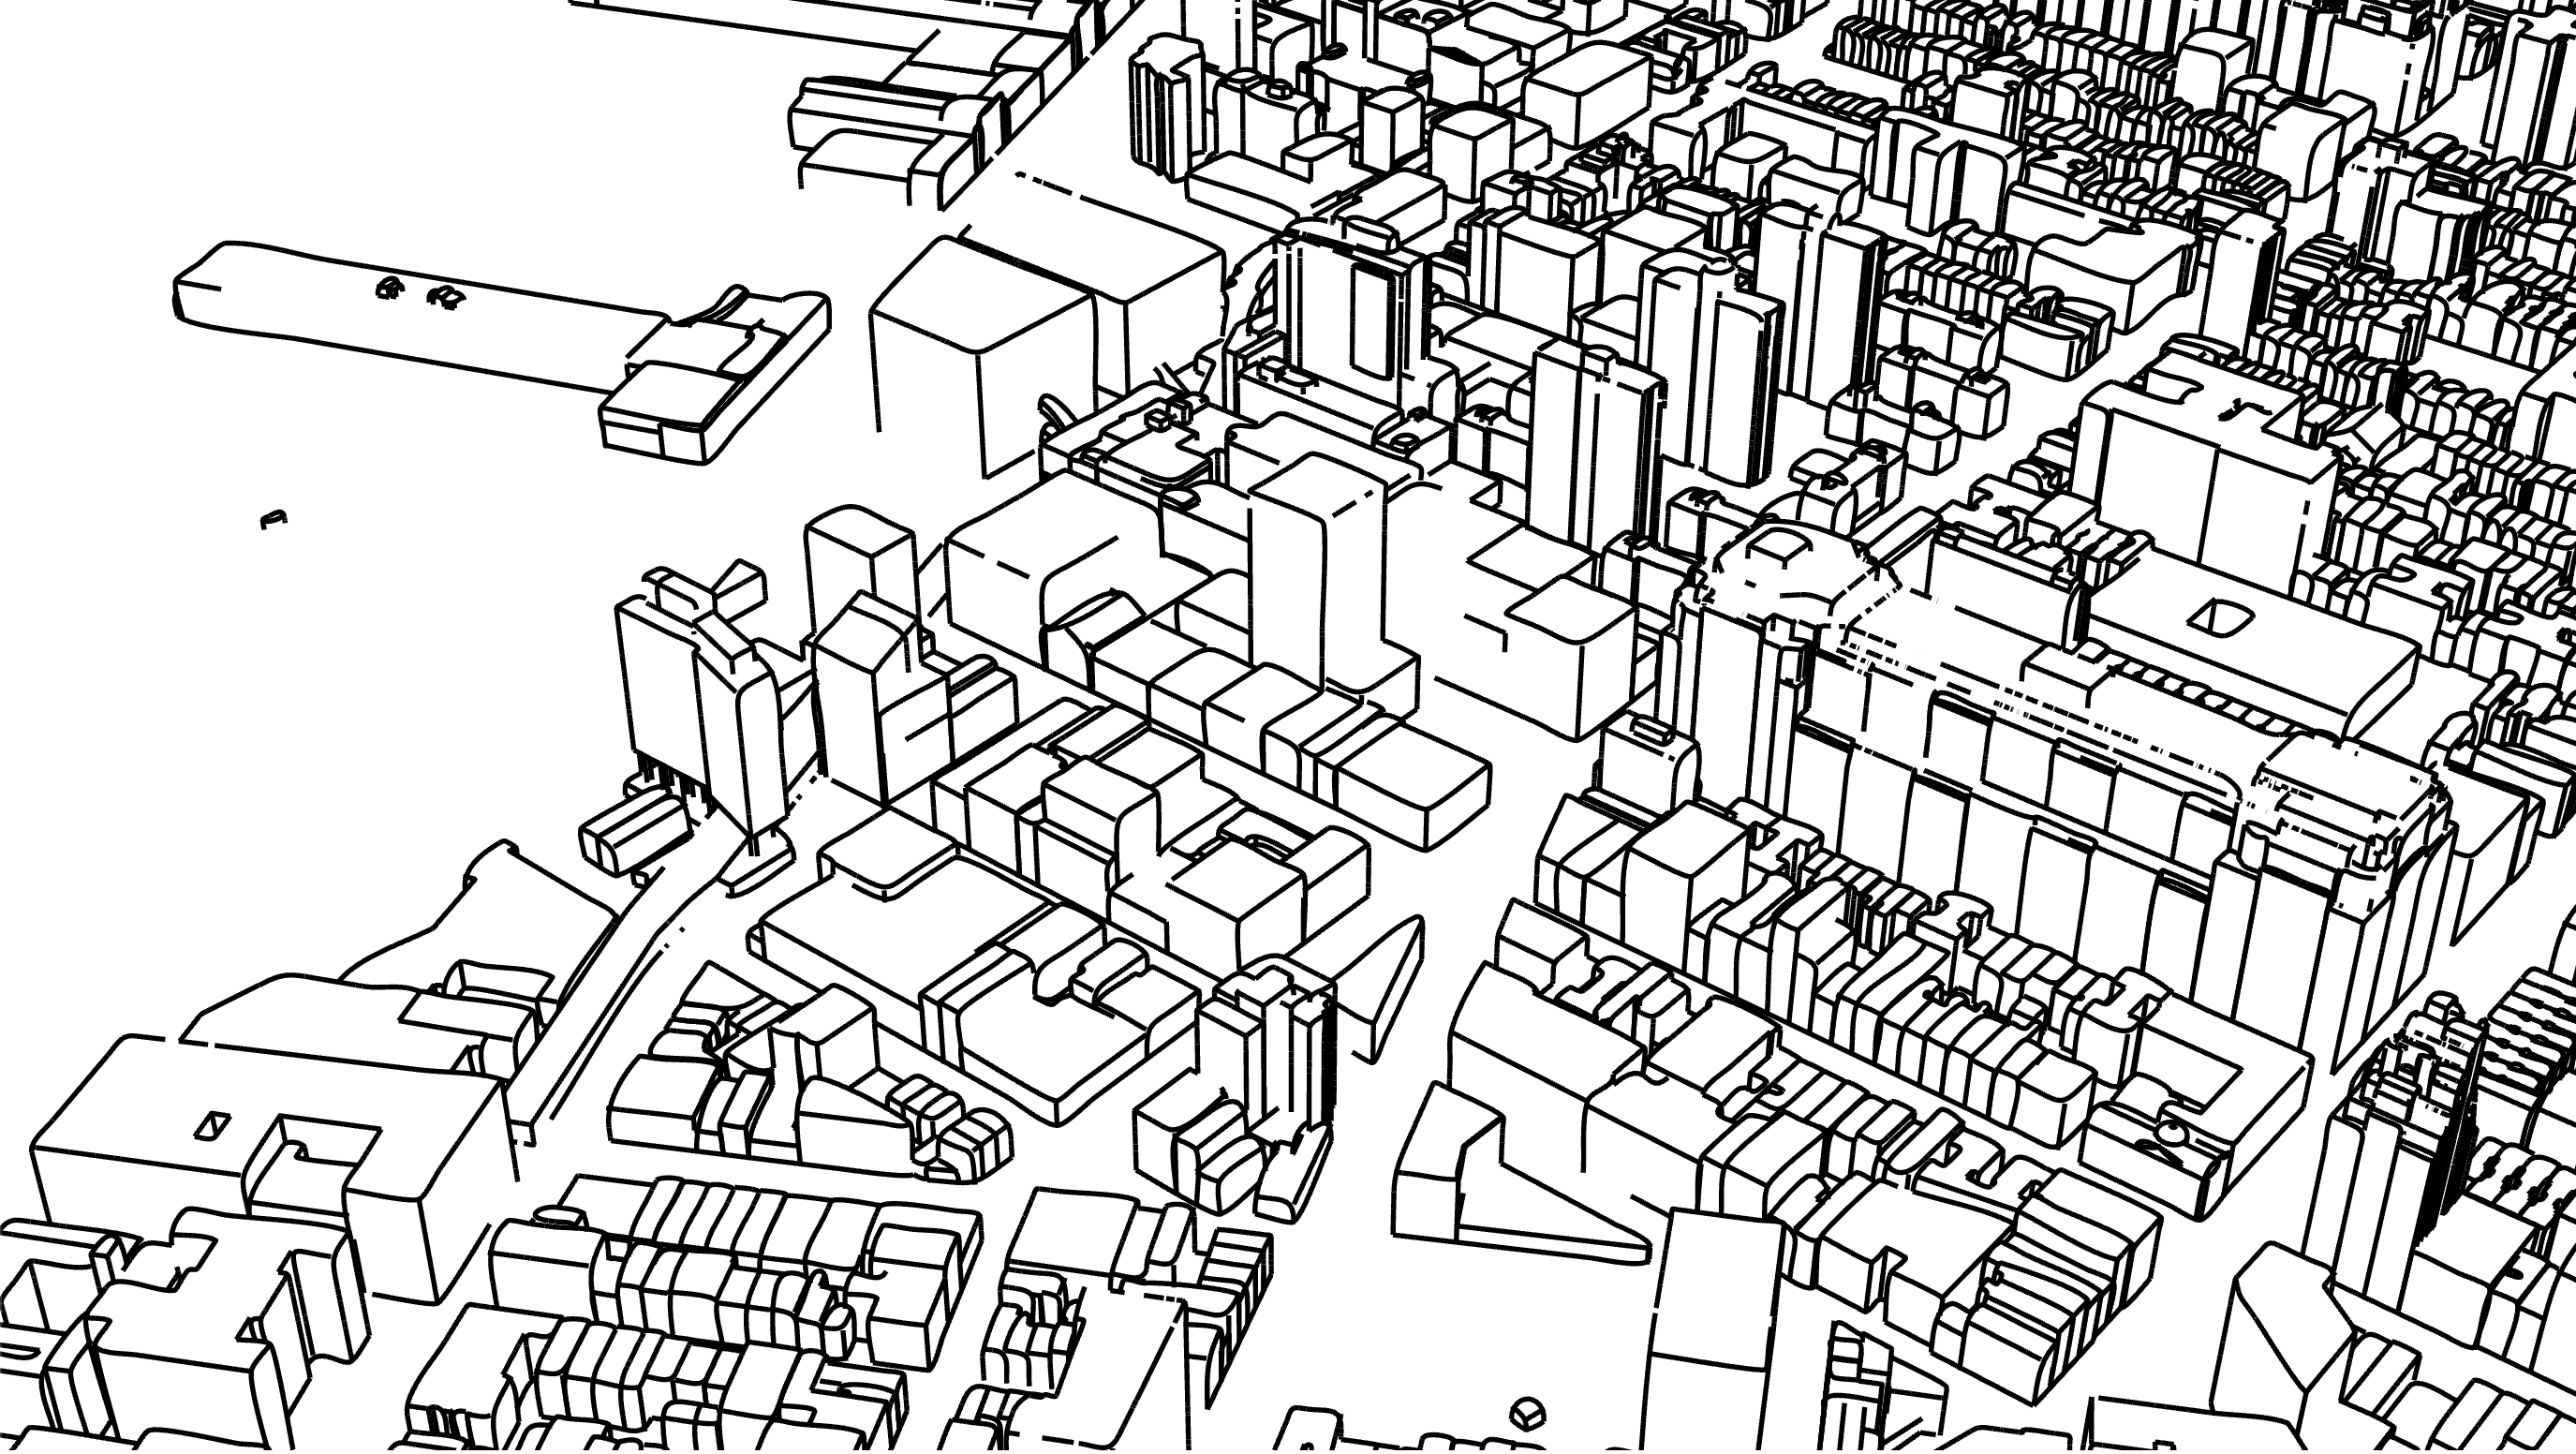
We end up with a detailed 3D model…
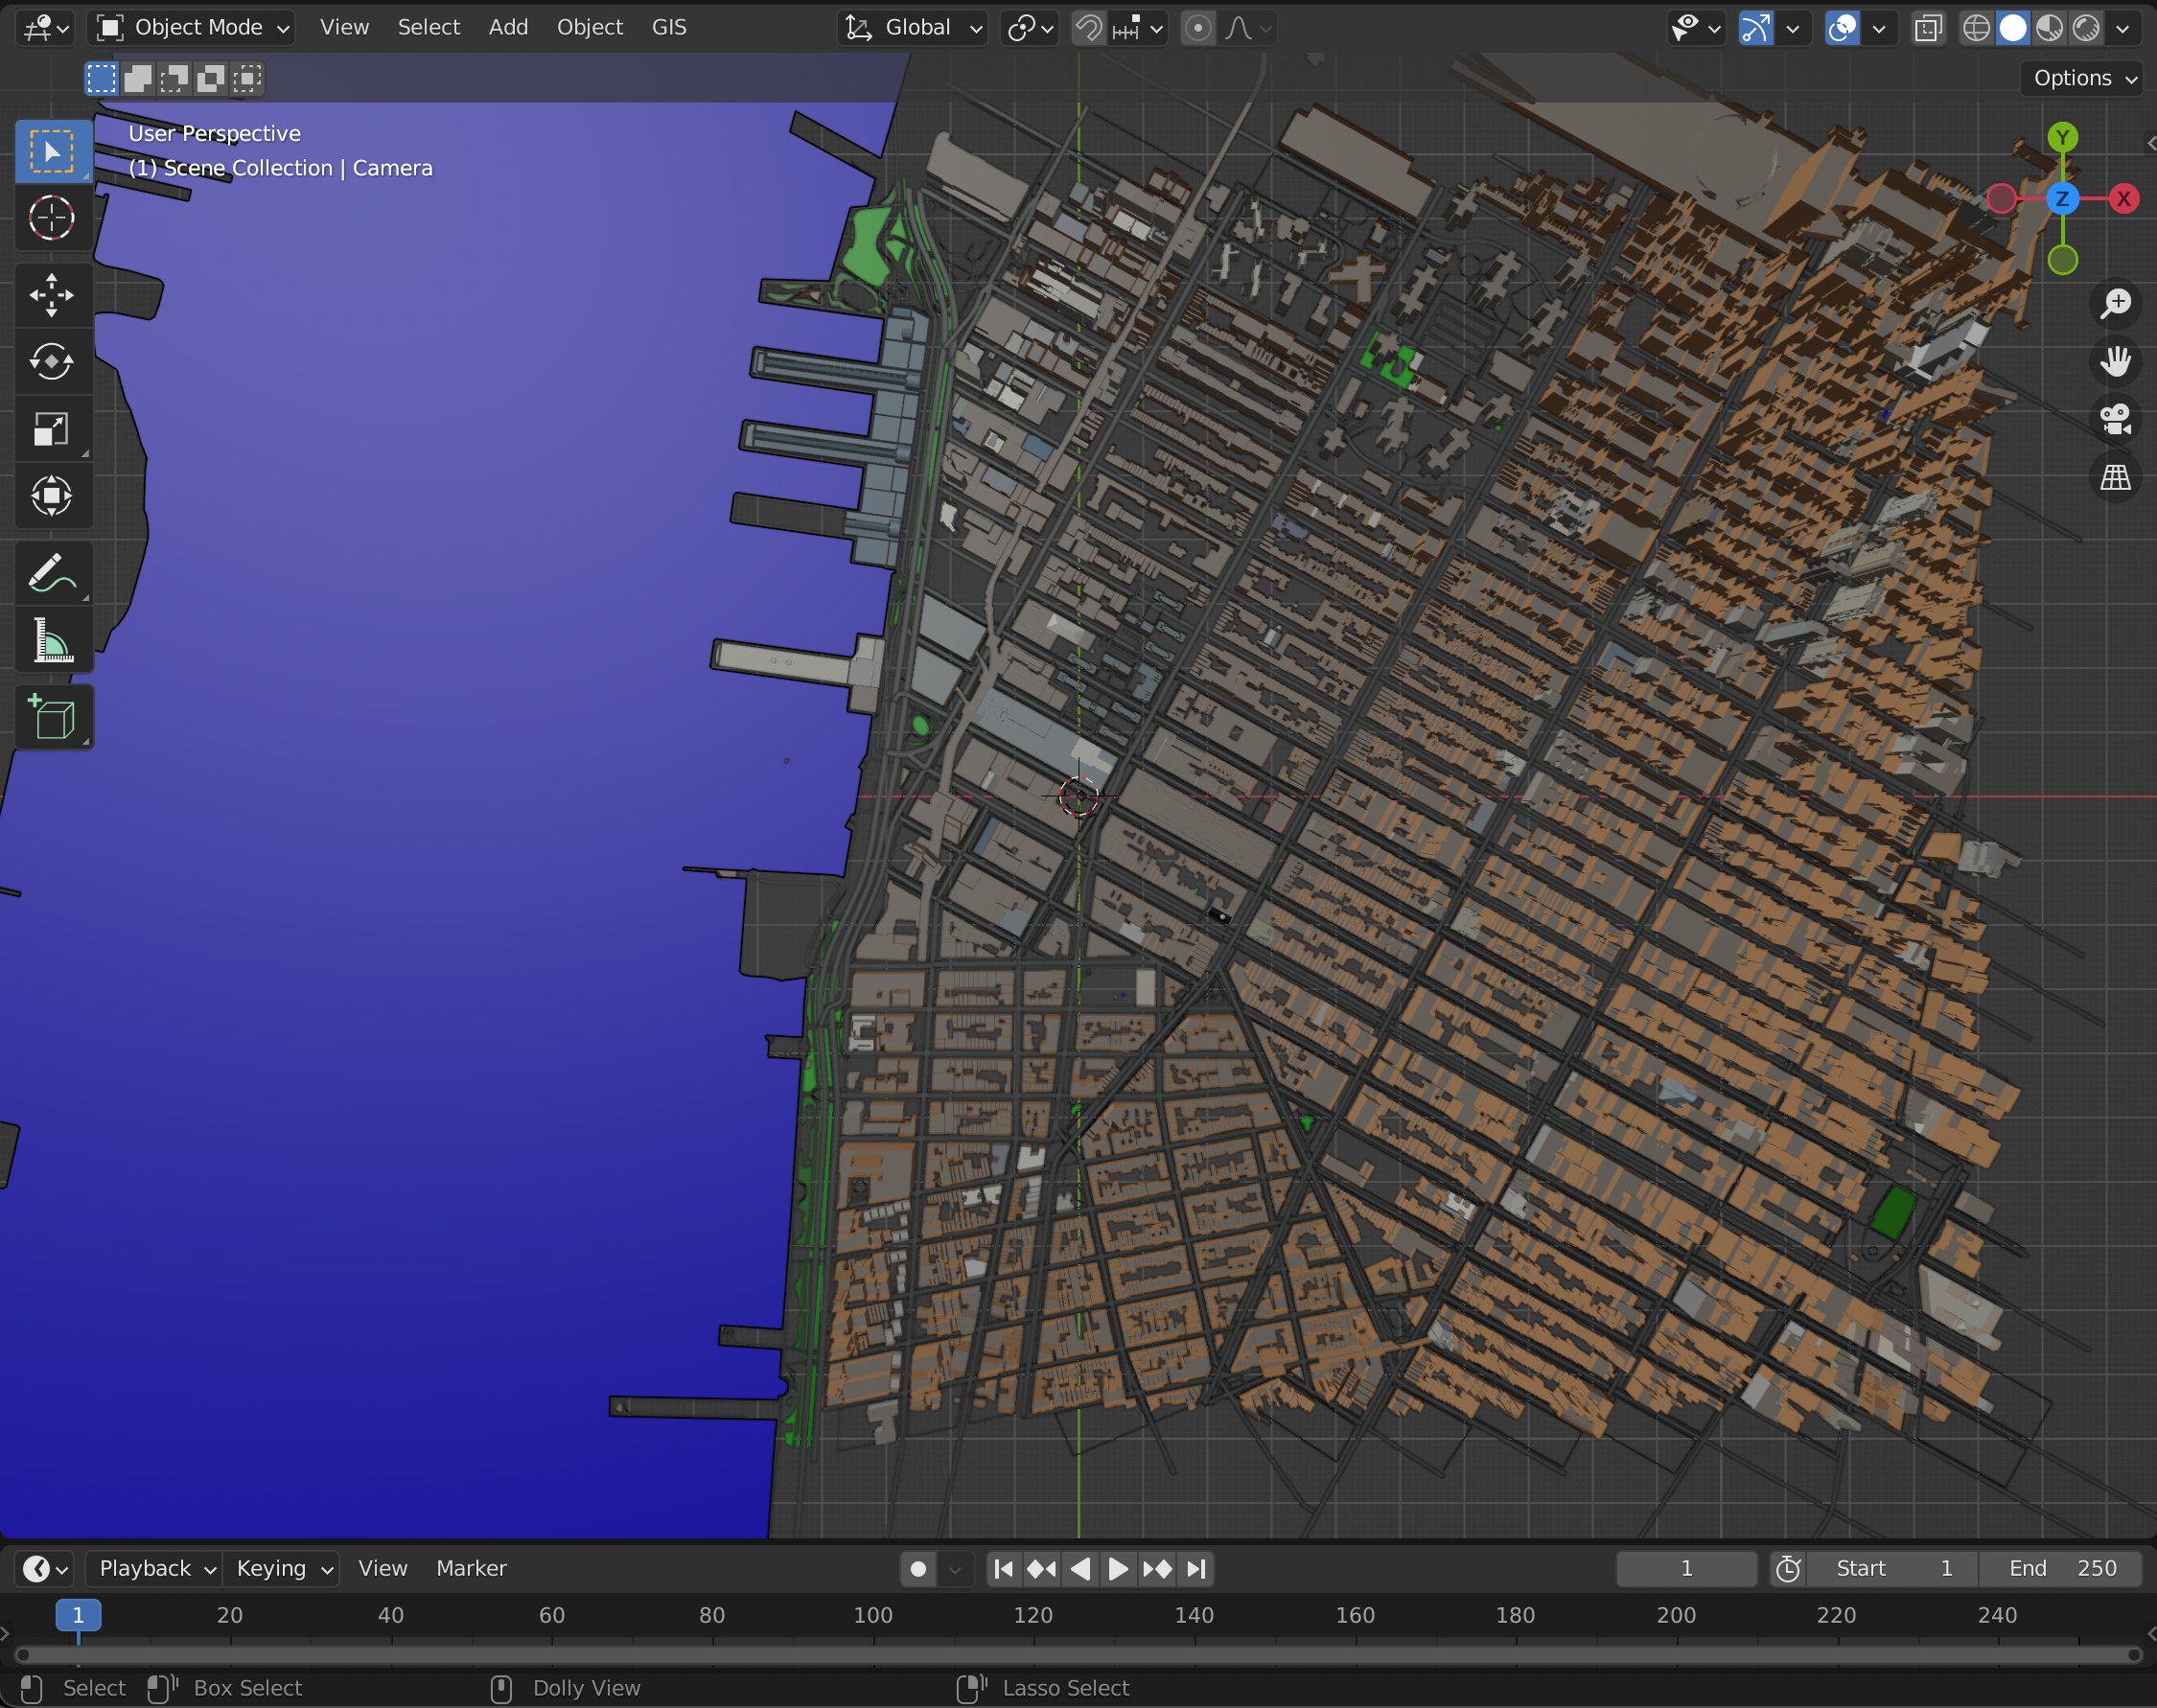
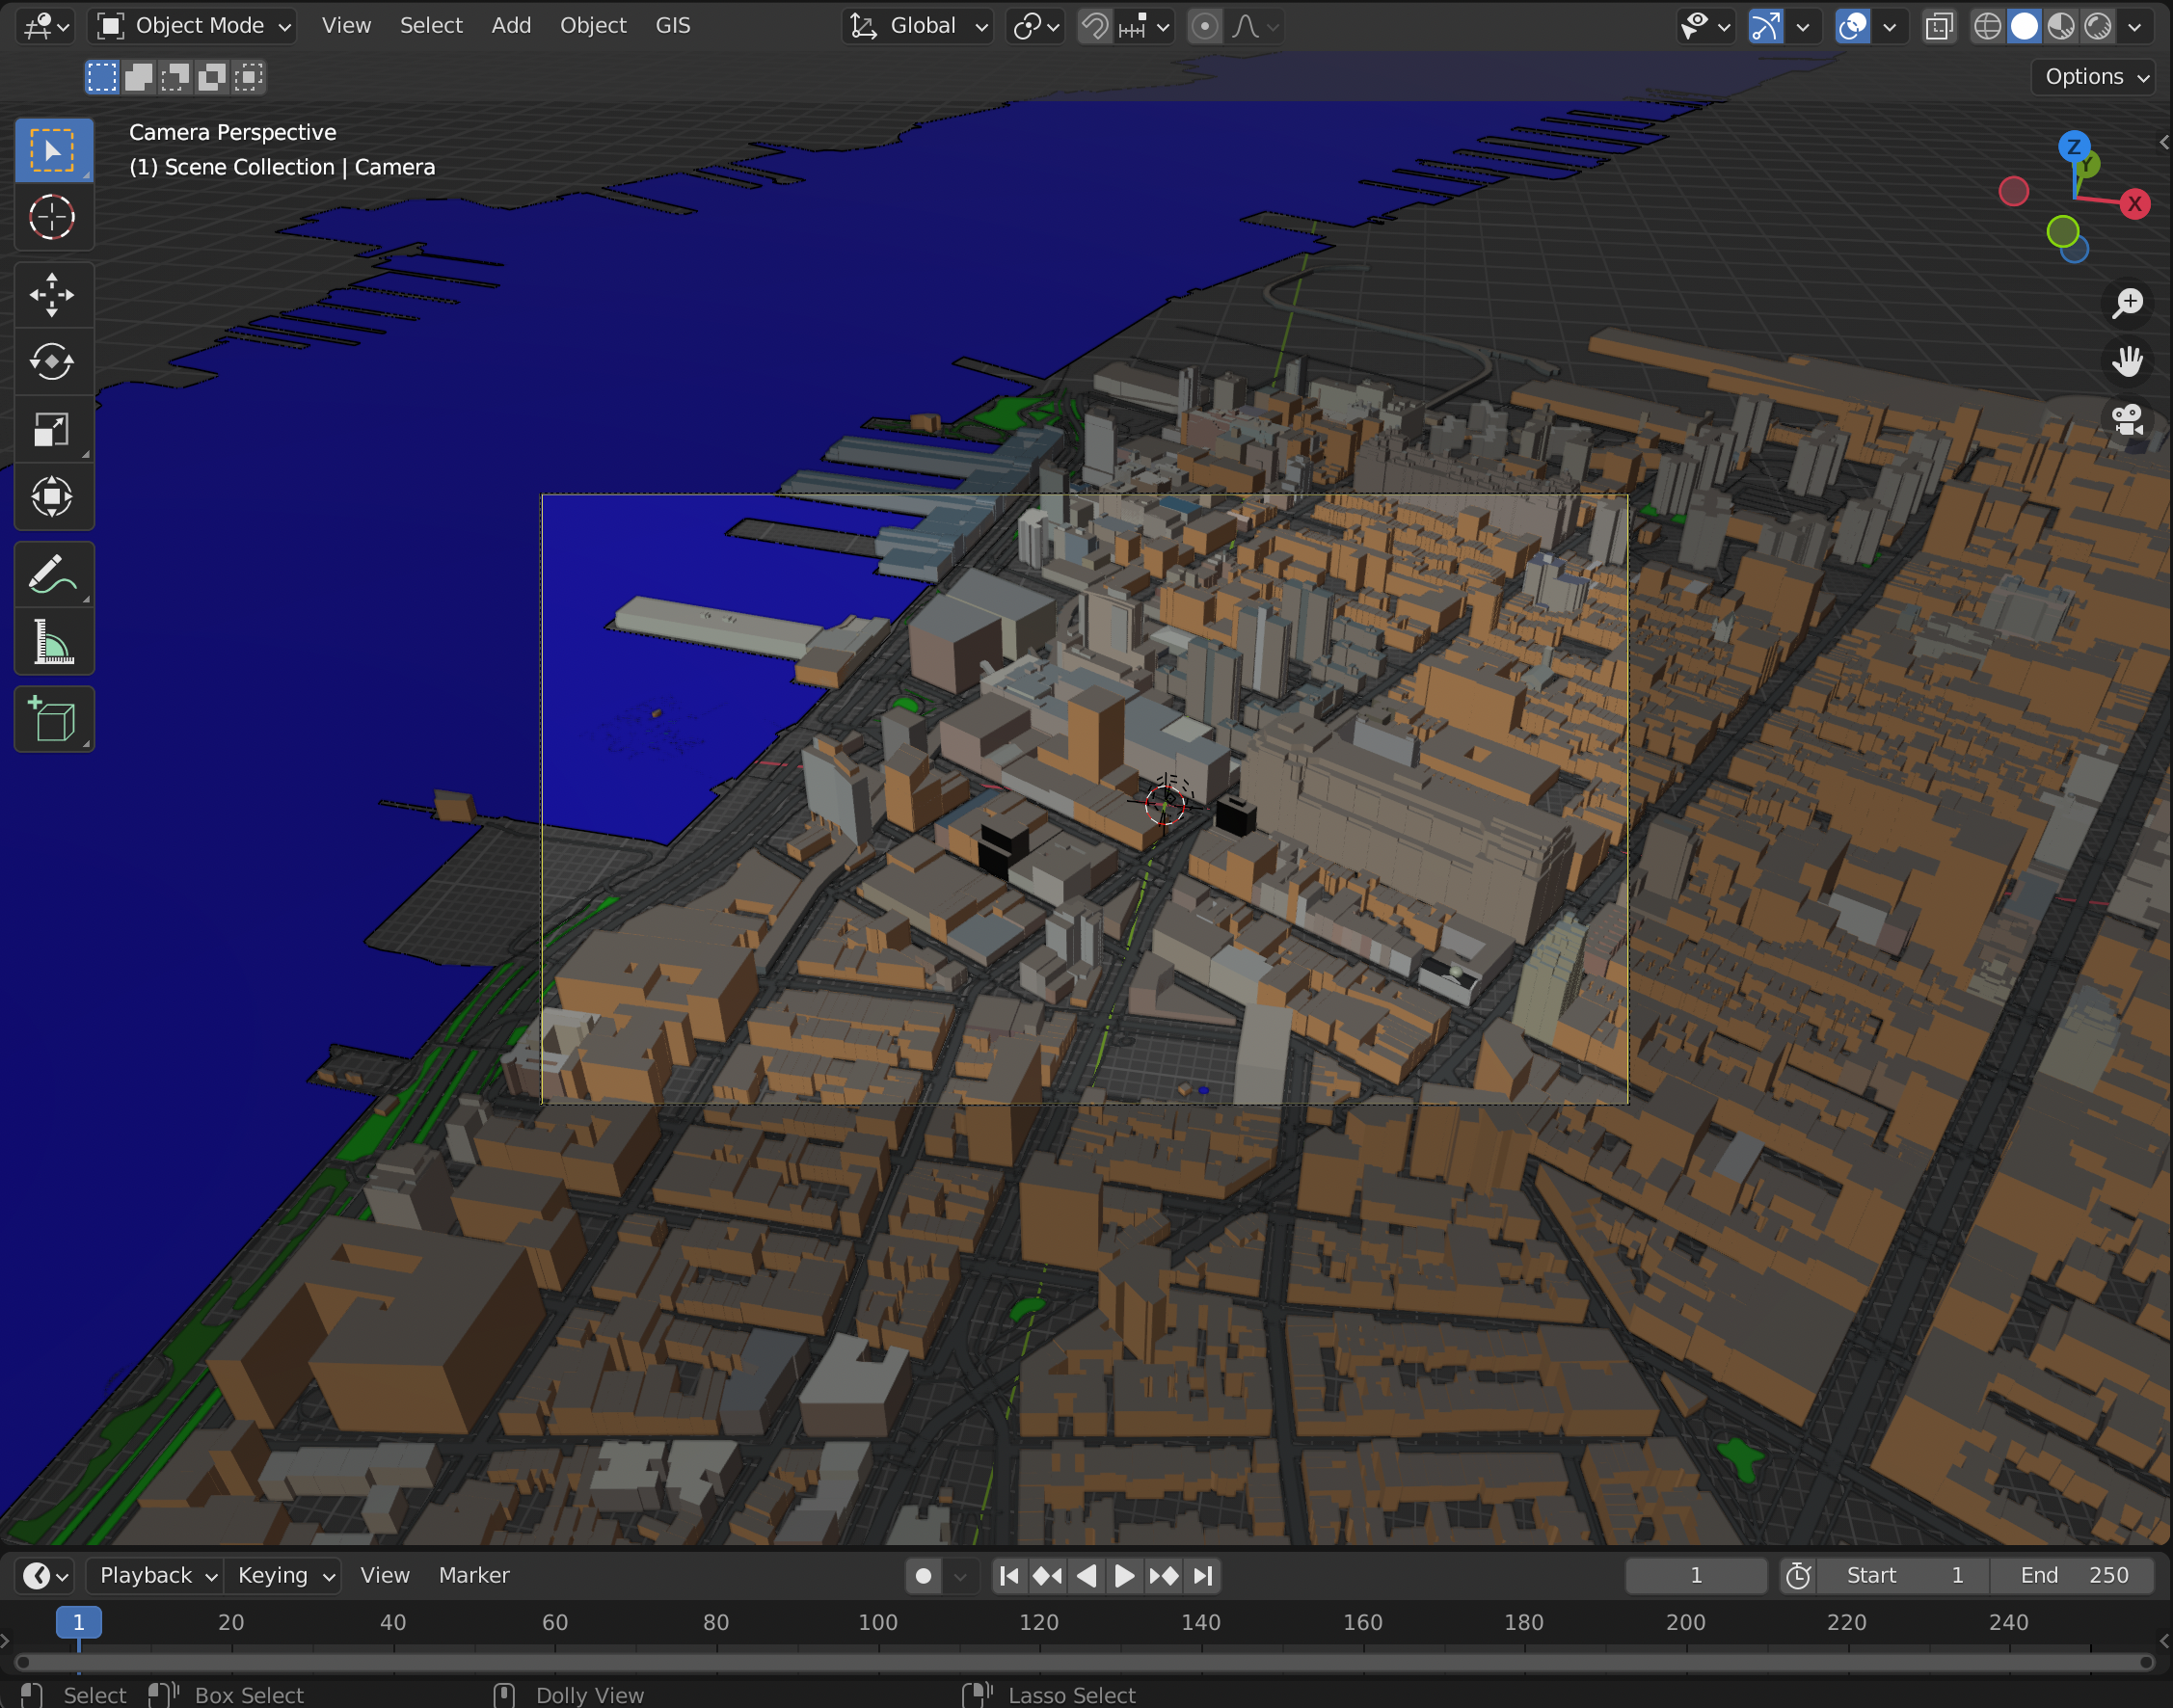
…but of course it looks better in perspective.
I knew I wanted to draw a multicolor print, so I grouped the downloaded layers by pen color. All the buildings went in one group, all primary roads in another, etc. Later I print these layers on the plotter one by one, swapping out the pen in between layers.
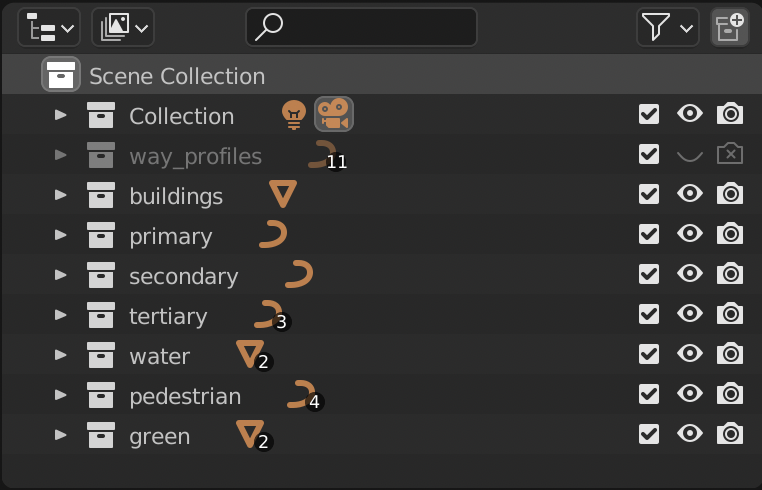
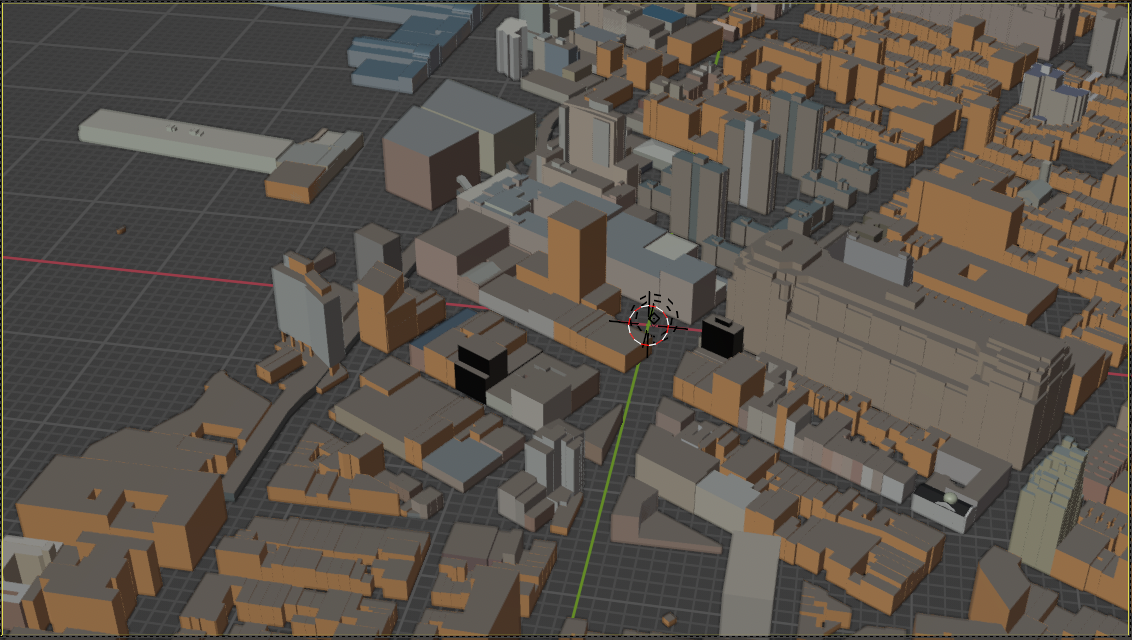
Using separate object collections means we can toggle on/off items by layer in the Blender UI. Here is a render of the map with only 3D buildings visible:
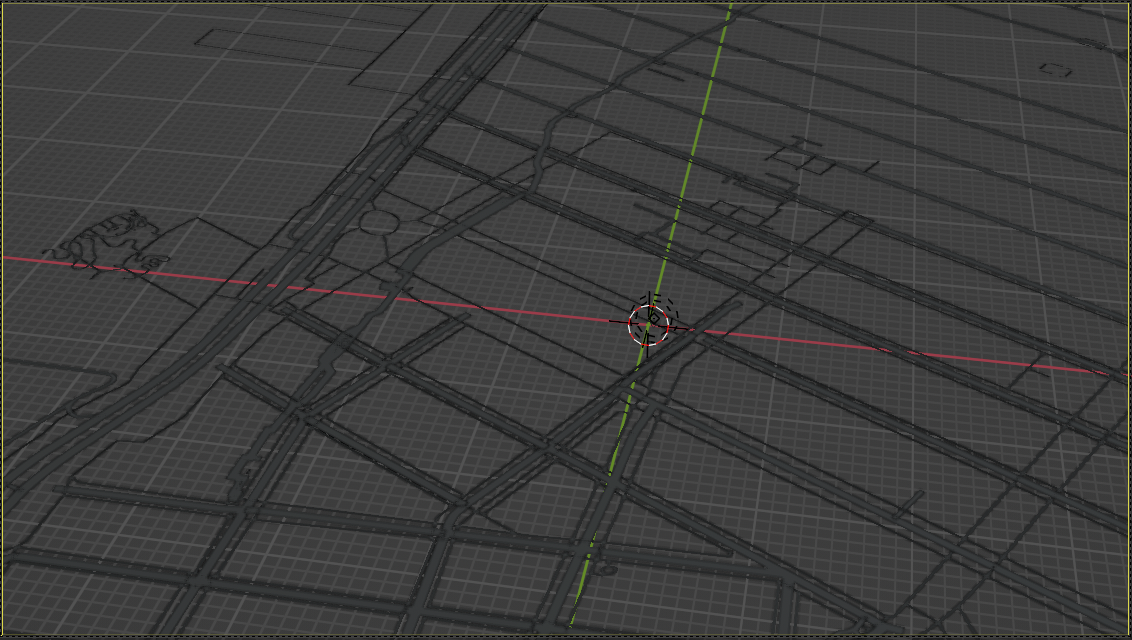
and another render of the map with only primary and secondary highways visible:

and another render of the map with only pedestrian roads visible.
Of course, we can render this for any combination of the layers.
The result is a 3D model in Blender which can be exported as a raster image or as an animation. But the pen plotter expects vector data, so we have to use a plugin.
Freestyle SVG Exporter⌗
Freestyle is a Blender plugin which plots the edges of visible objects as SVG lines.
This is perfect for pen plotting, since pen plotters expect vector input.
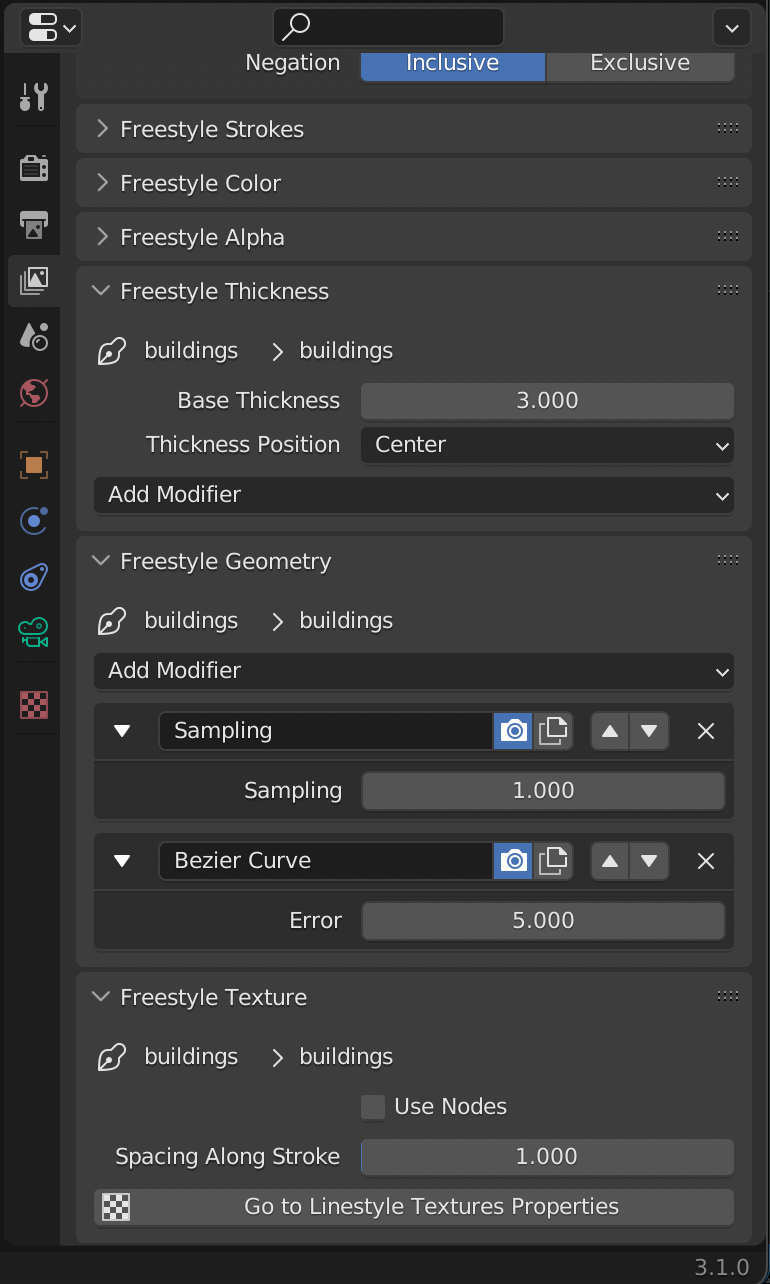
Freestyle is very powerful but a bit hard to use. First I enabled it like so:
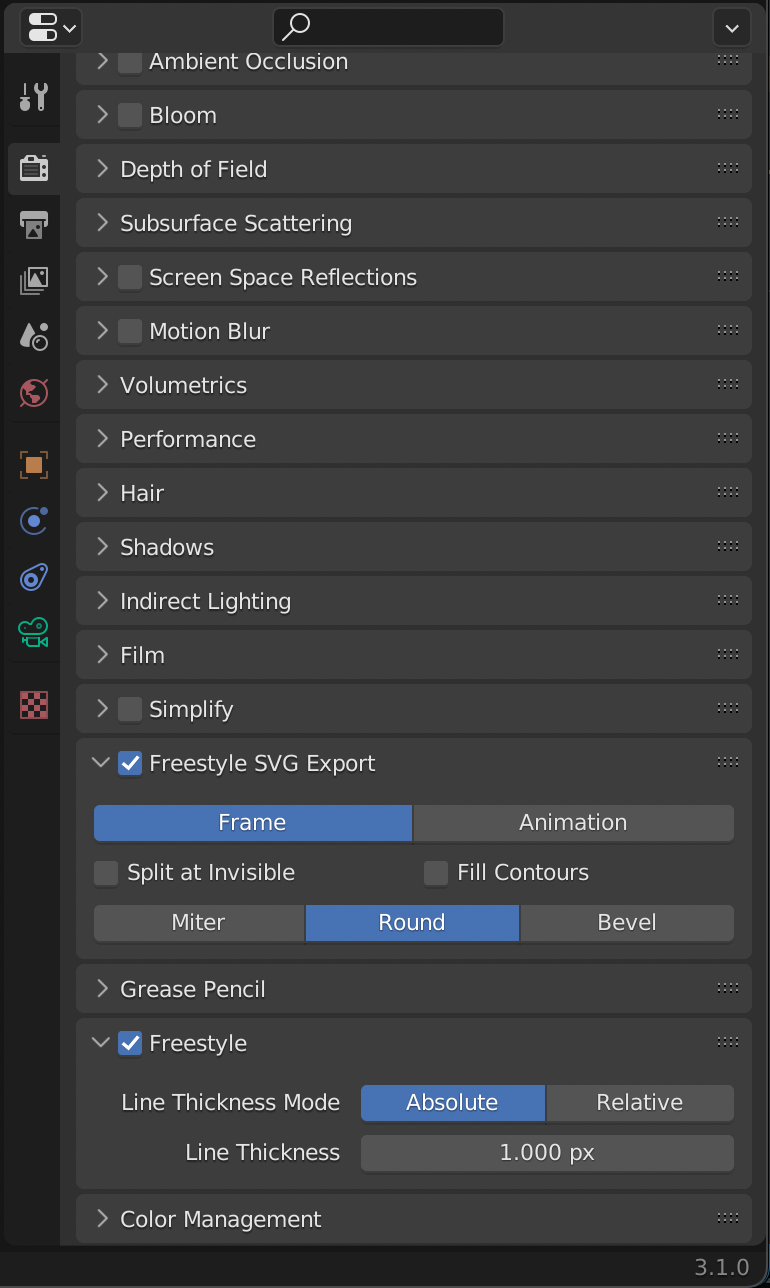
Then I played with the settings until it handled crease angles in the way I expected.
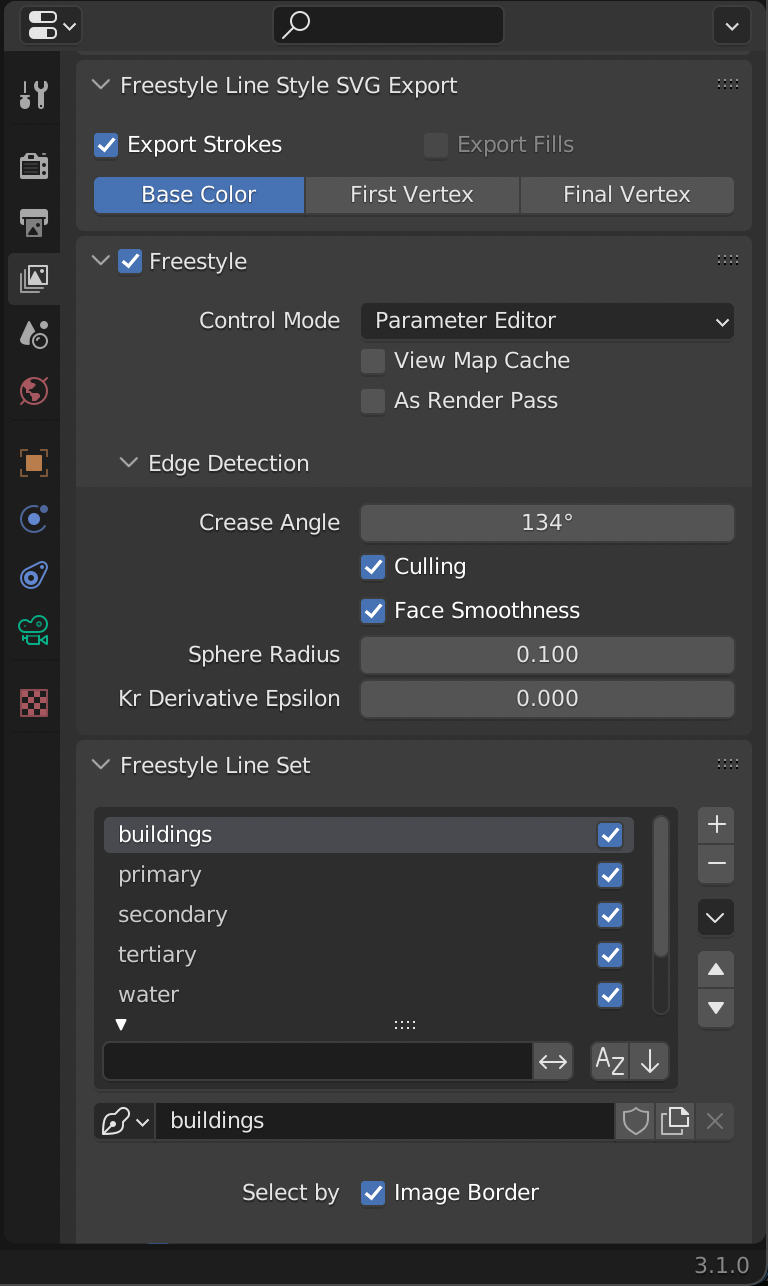
I also applied a Bezier filter which gave the finished edges a cartoonish curve.
It’s hard to tell the effects of these settings until Blender actually renders the scene to SVG.
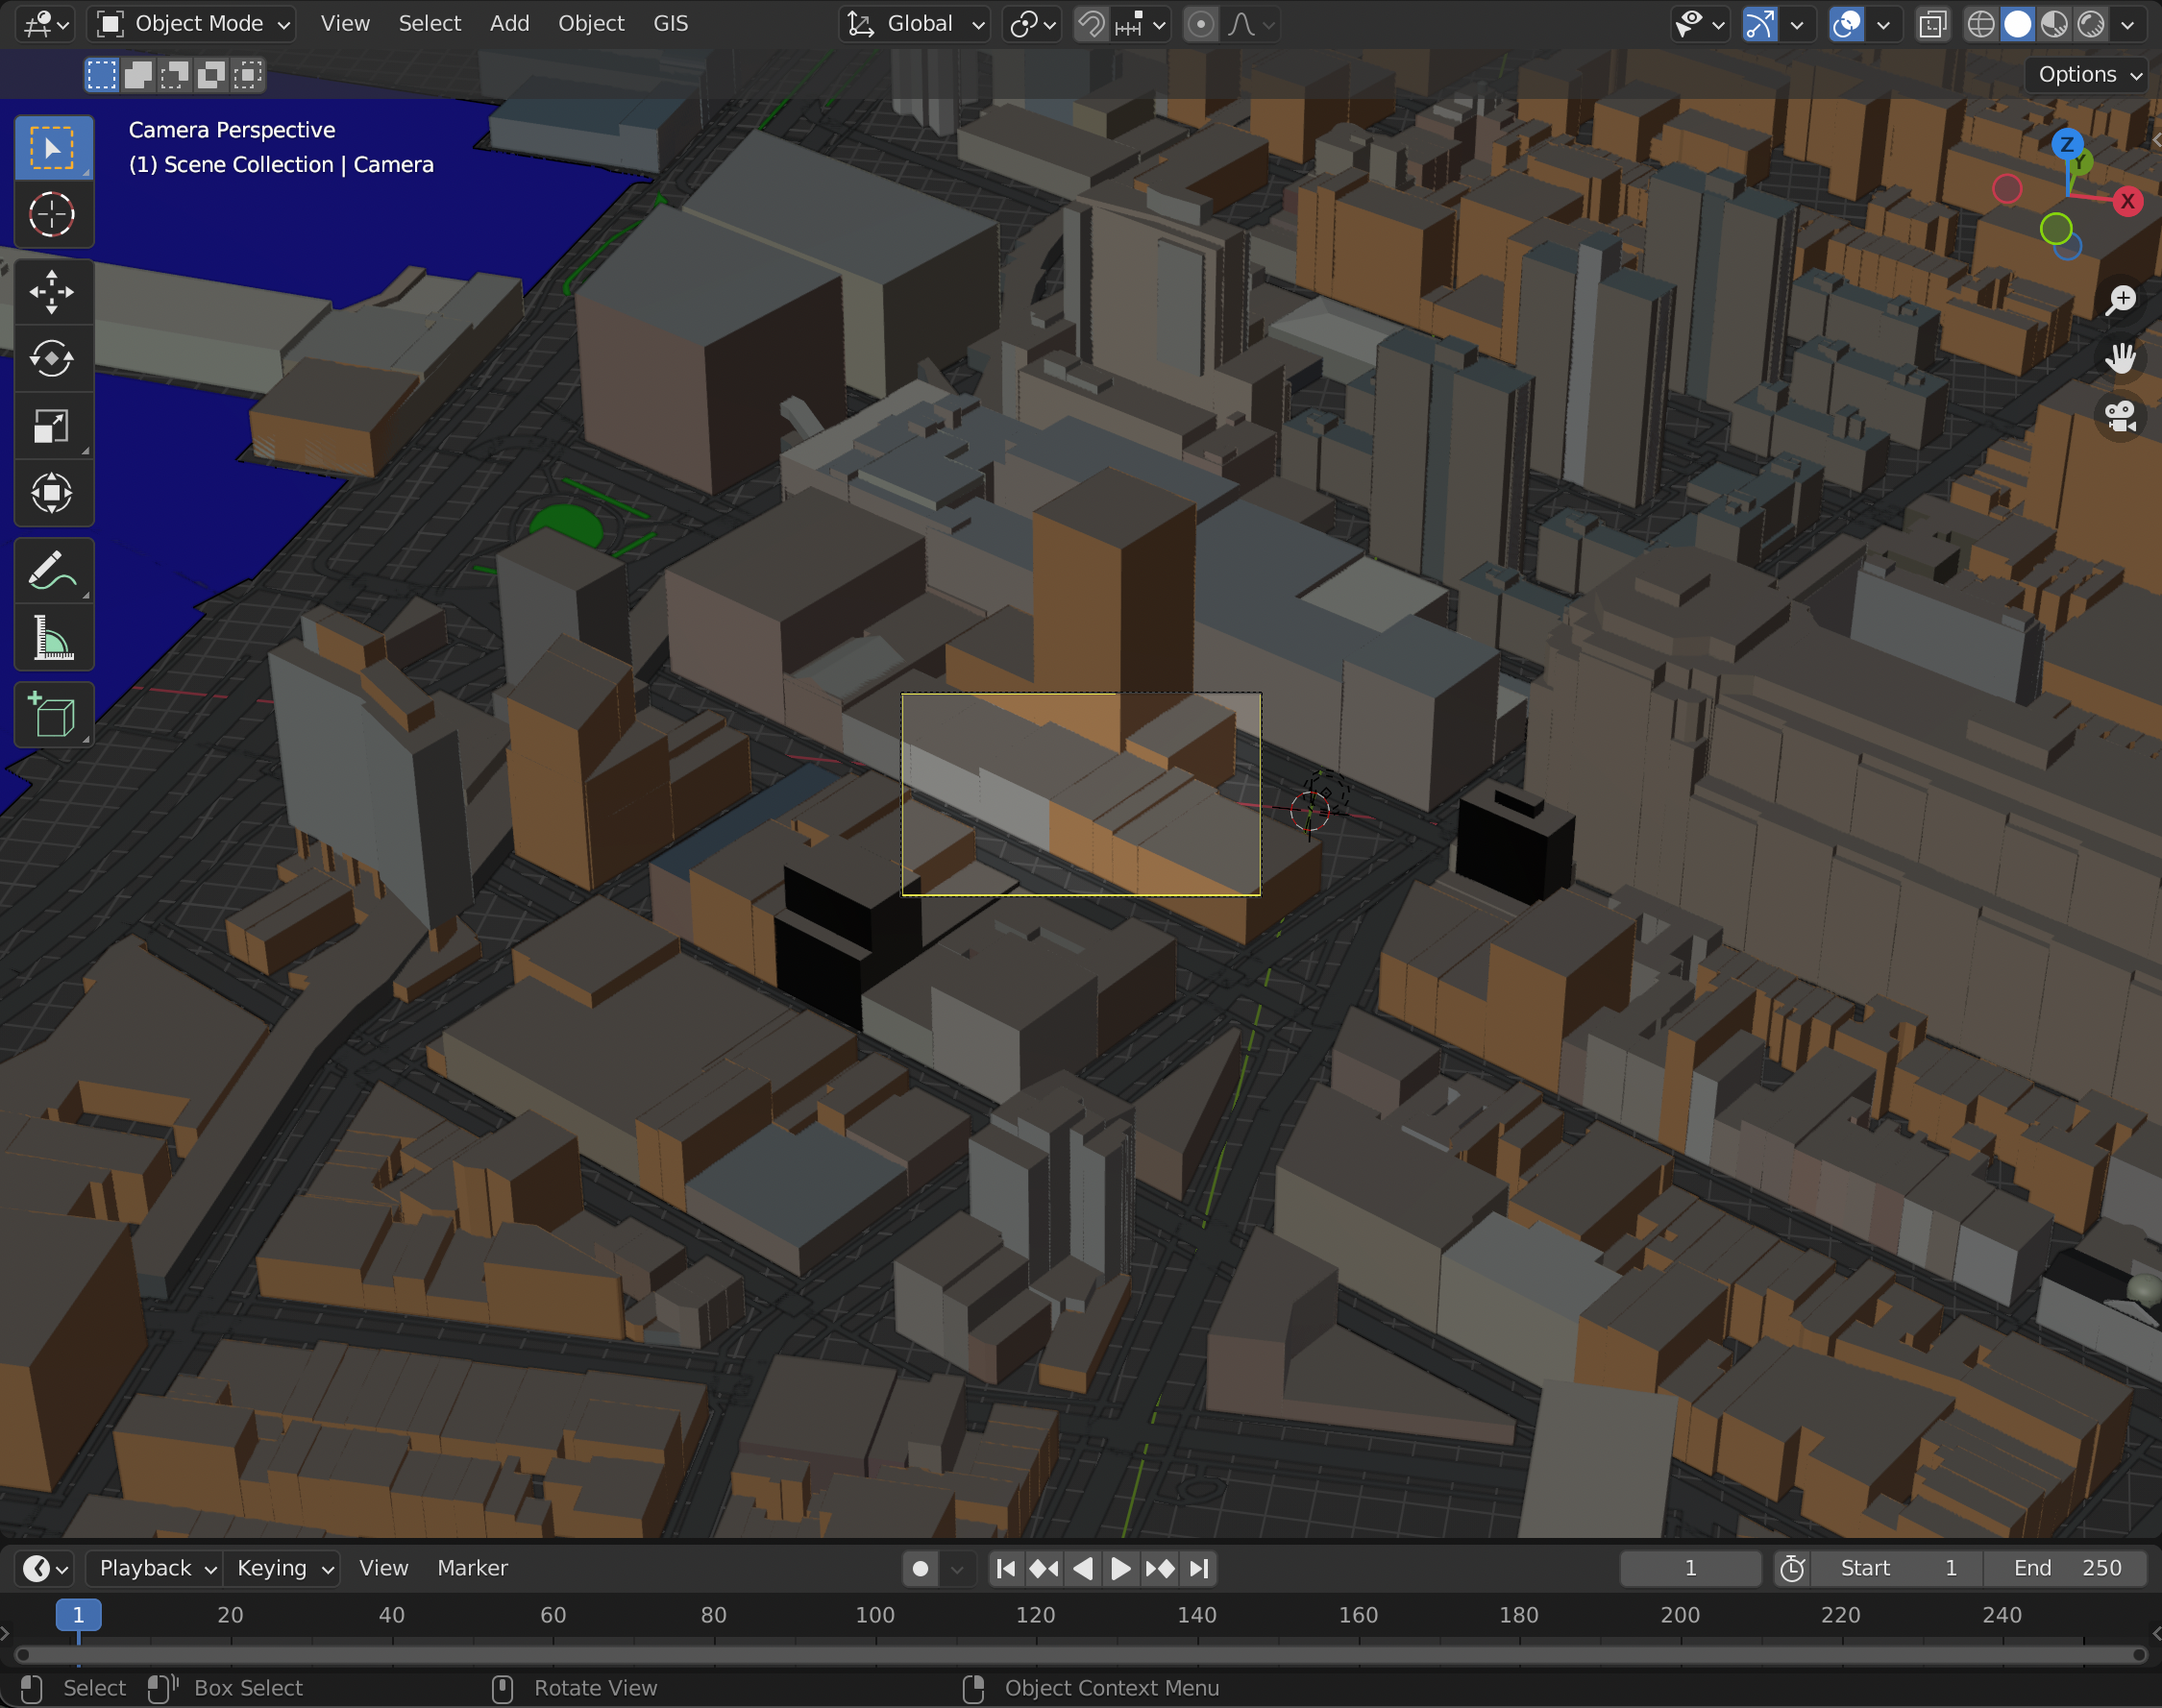
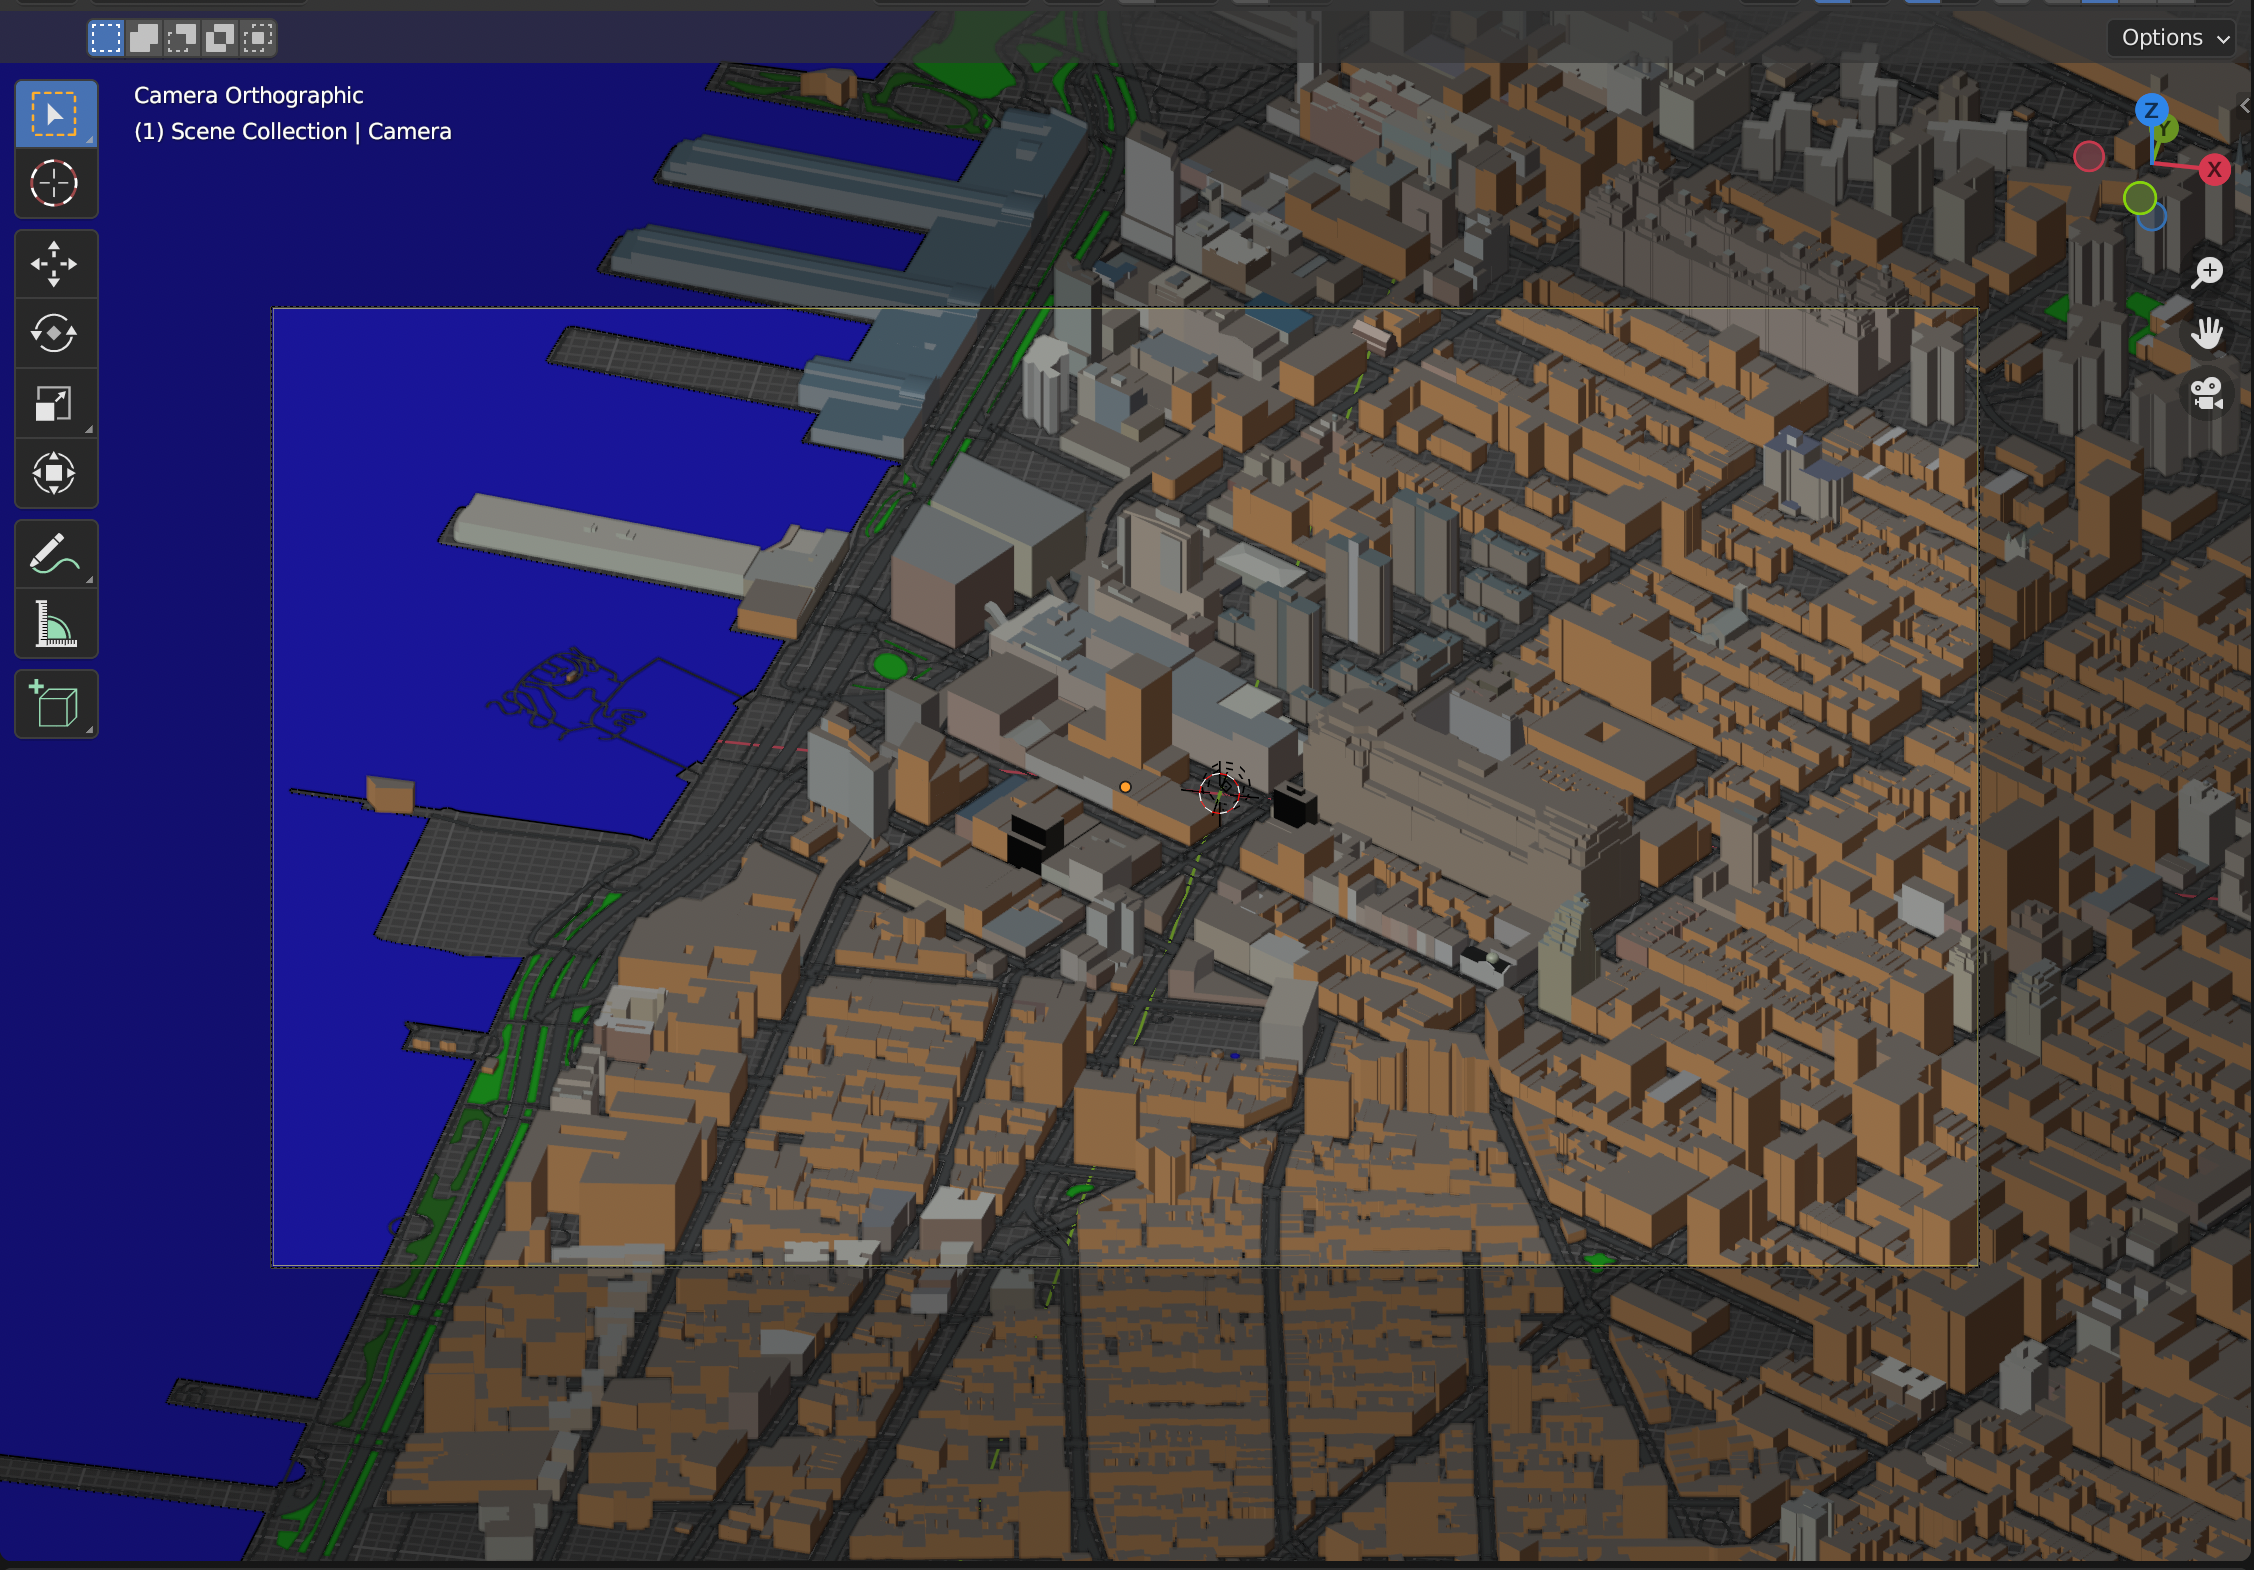
Camera⌗
Finally I played with the camera location and perspective settings until I had a scene composition I liked. The focal length of the virtual camera makes a big difference:
It is also possible to swap out a perspective camera for an orthographic one, which looks isometric like a video game. This is a nice effect but I felt it gave the scene some undesirable flatness.
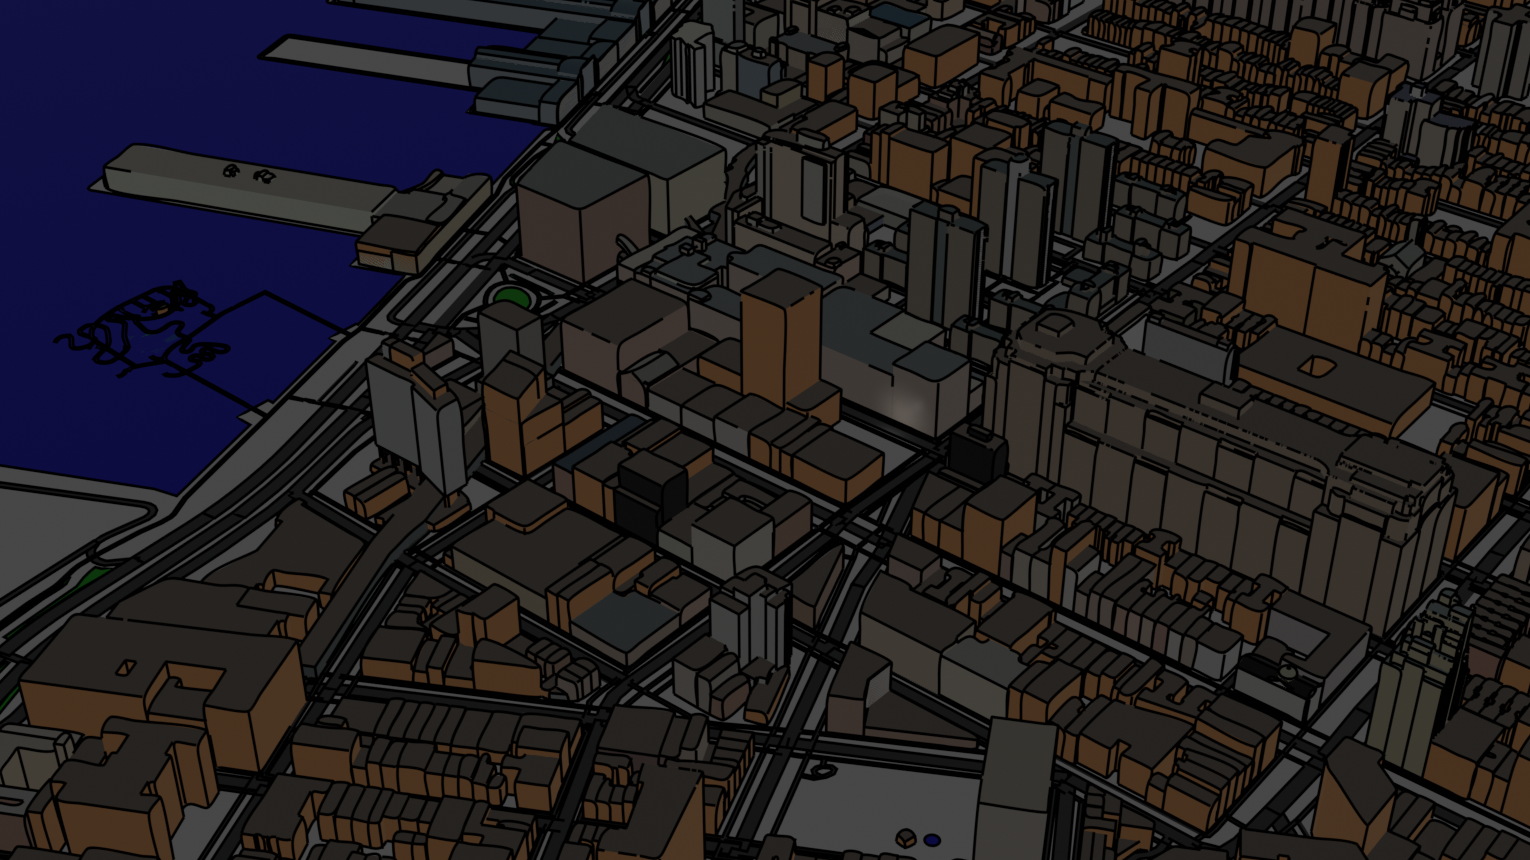
SVG⌗
The default exported PNG has both the raster image and the overlaid vector lines, which makes it easy to see why Freestyle drew lines in certain places.
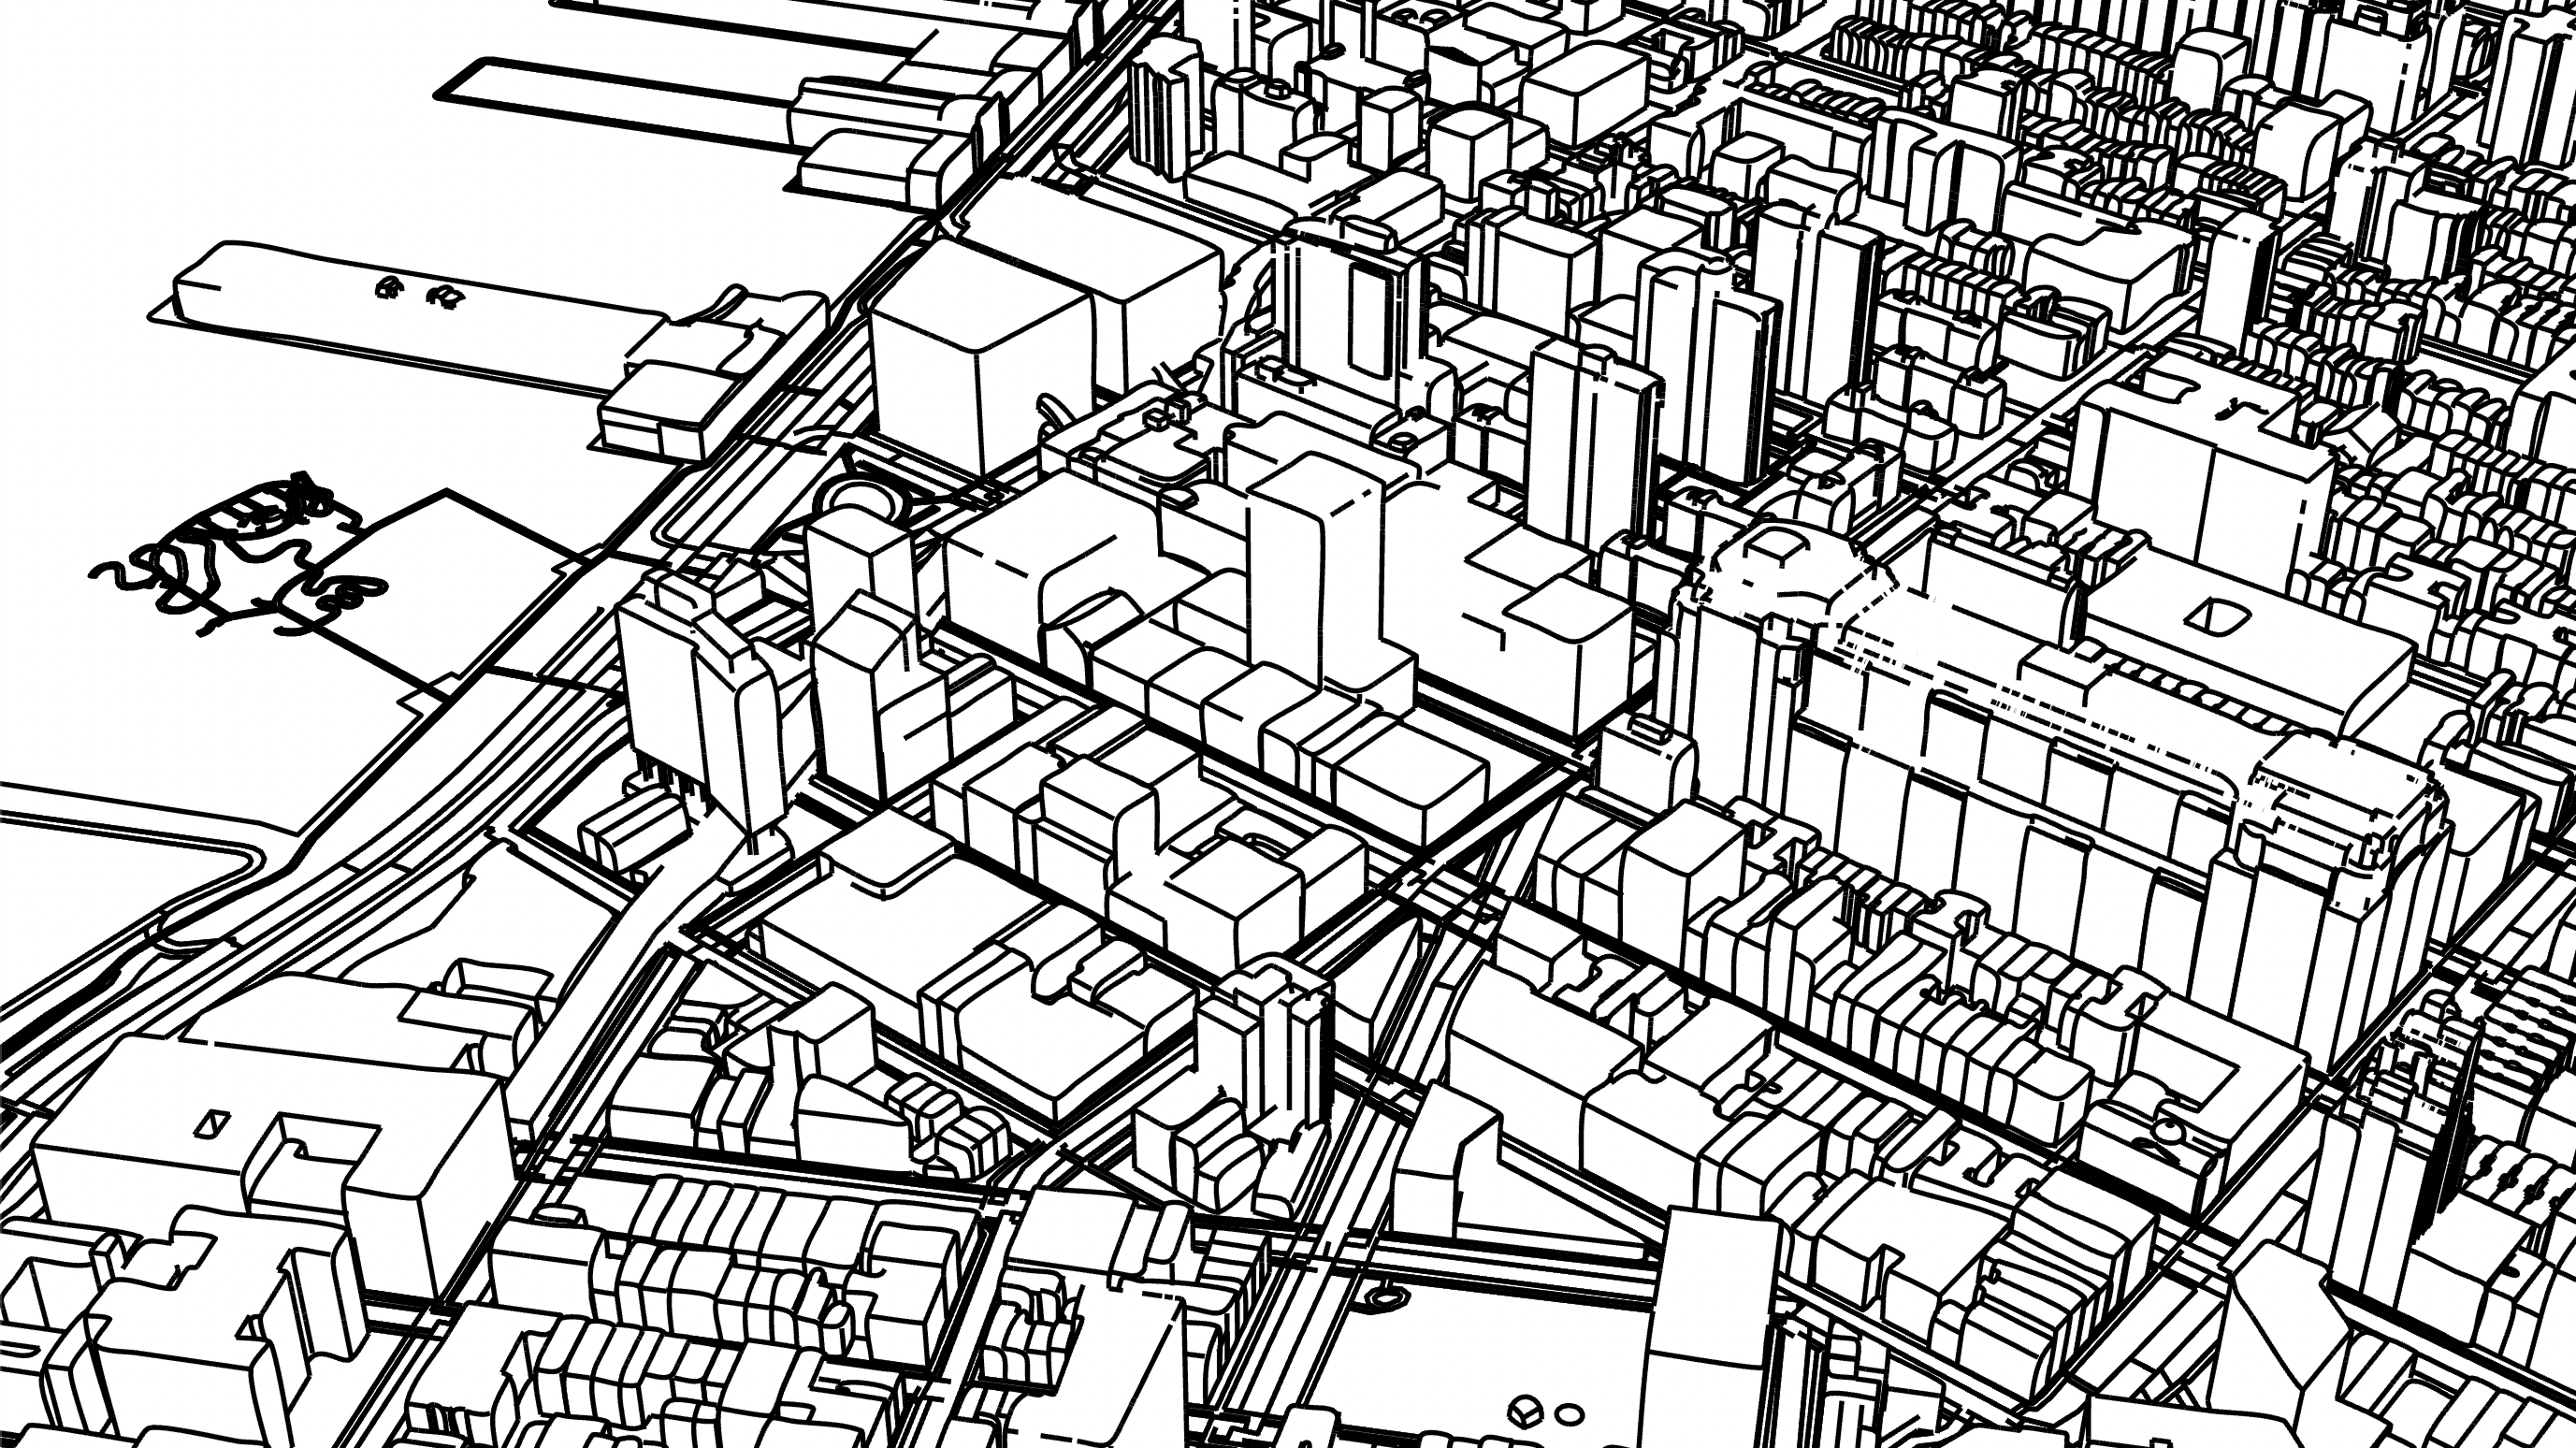
The default exported SVG is what we eventually send to the plotter.
Layers⌗
We can pop into the SVG file and separate the layers manually, since AxiDraw requires printing one SVG file at a time and cannot filter by layer. Here is the layer for buildings-only:
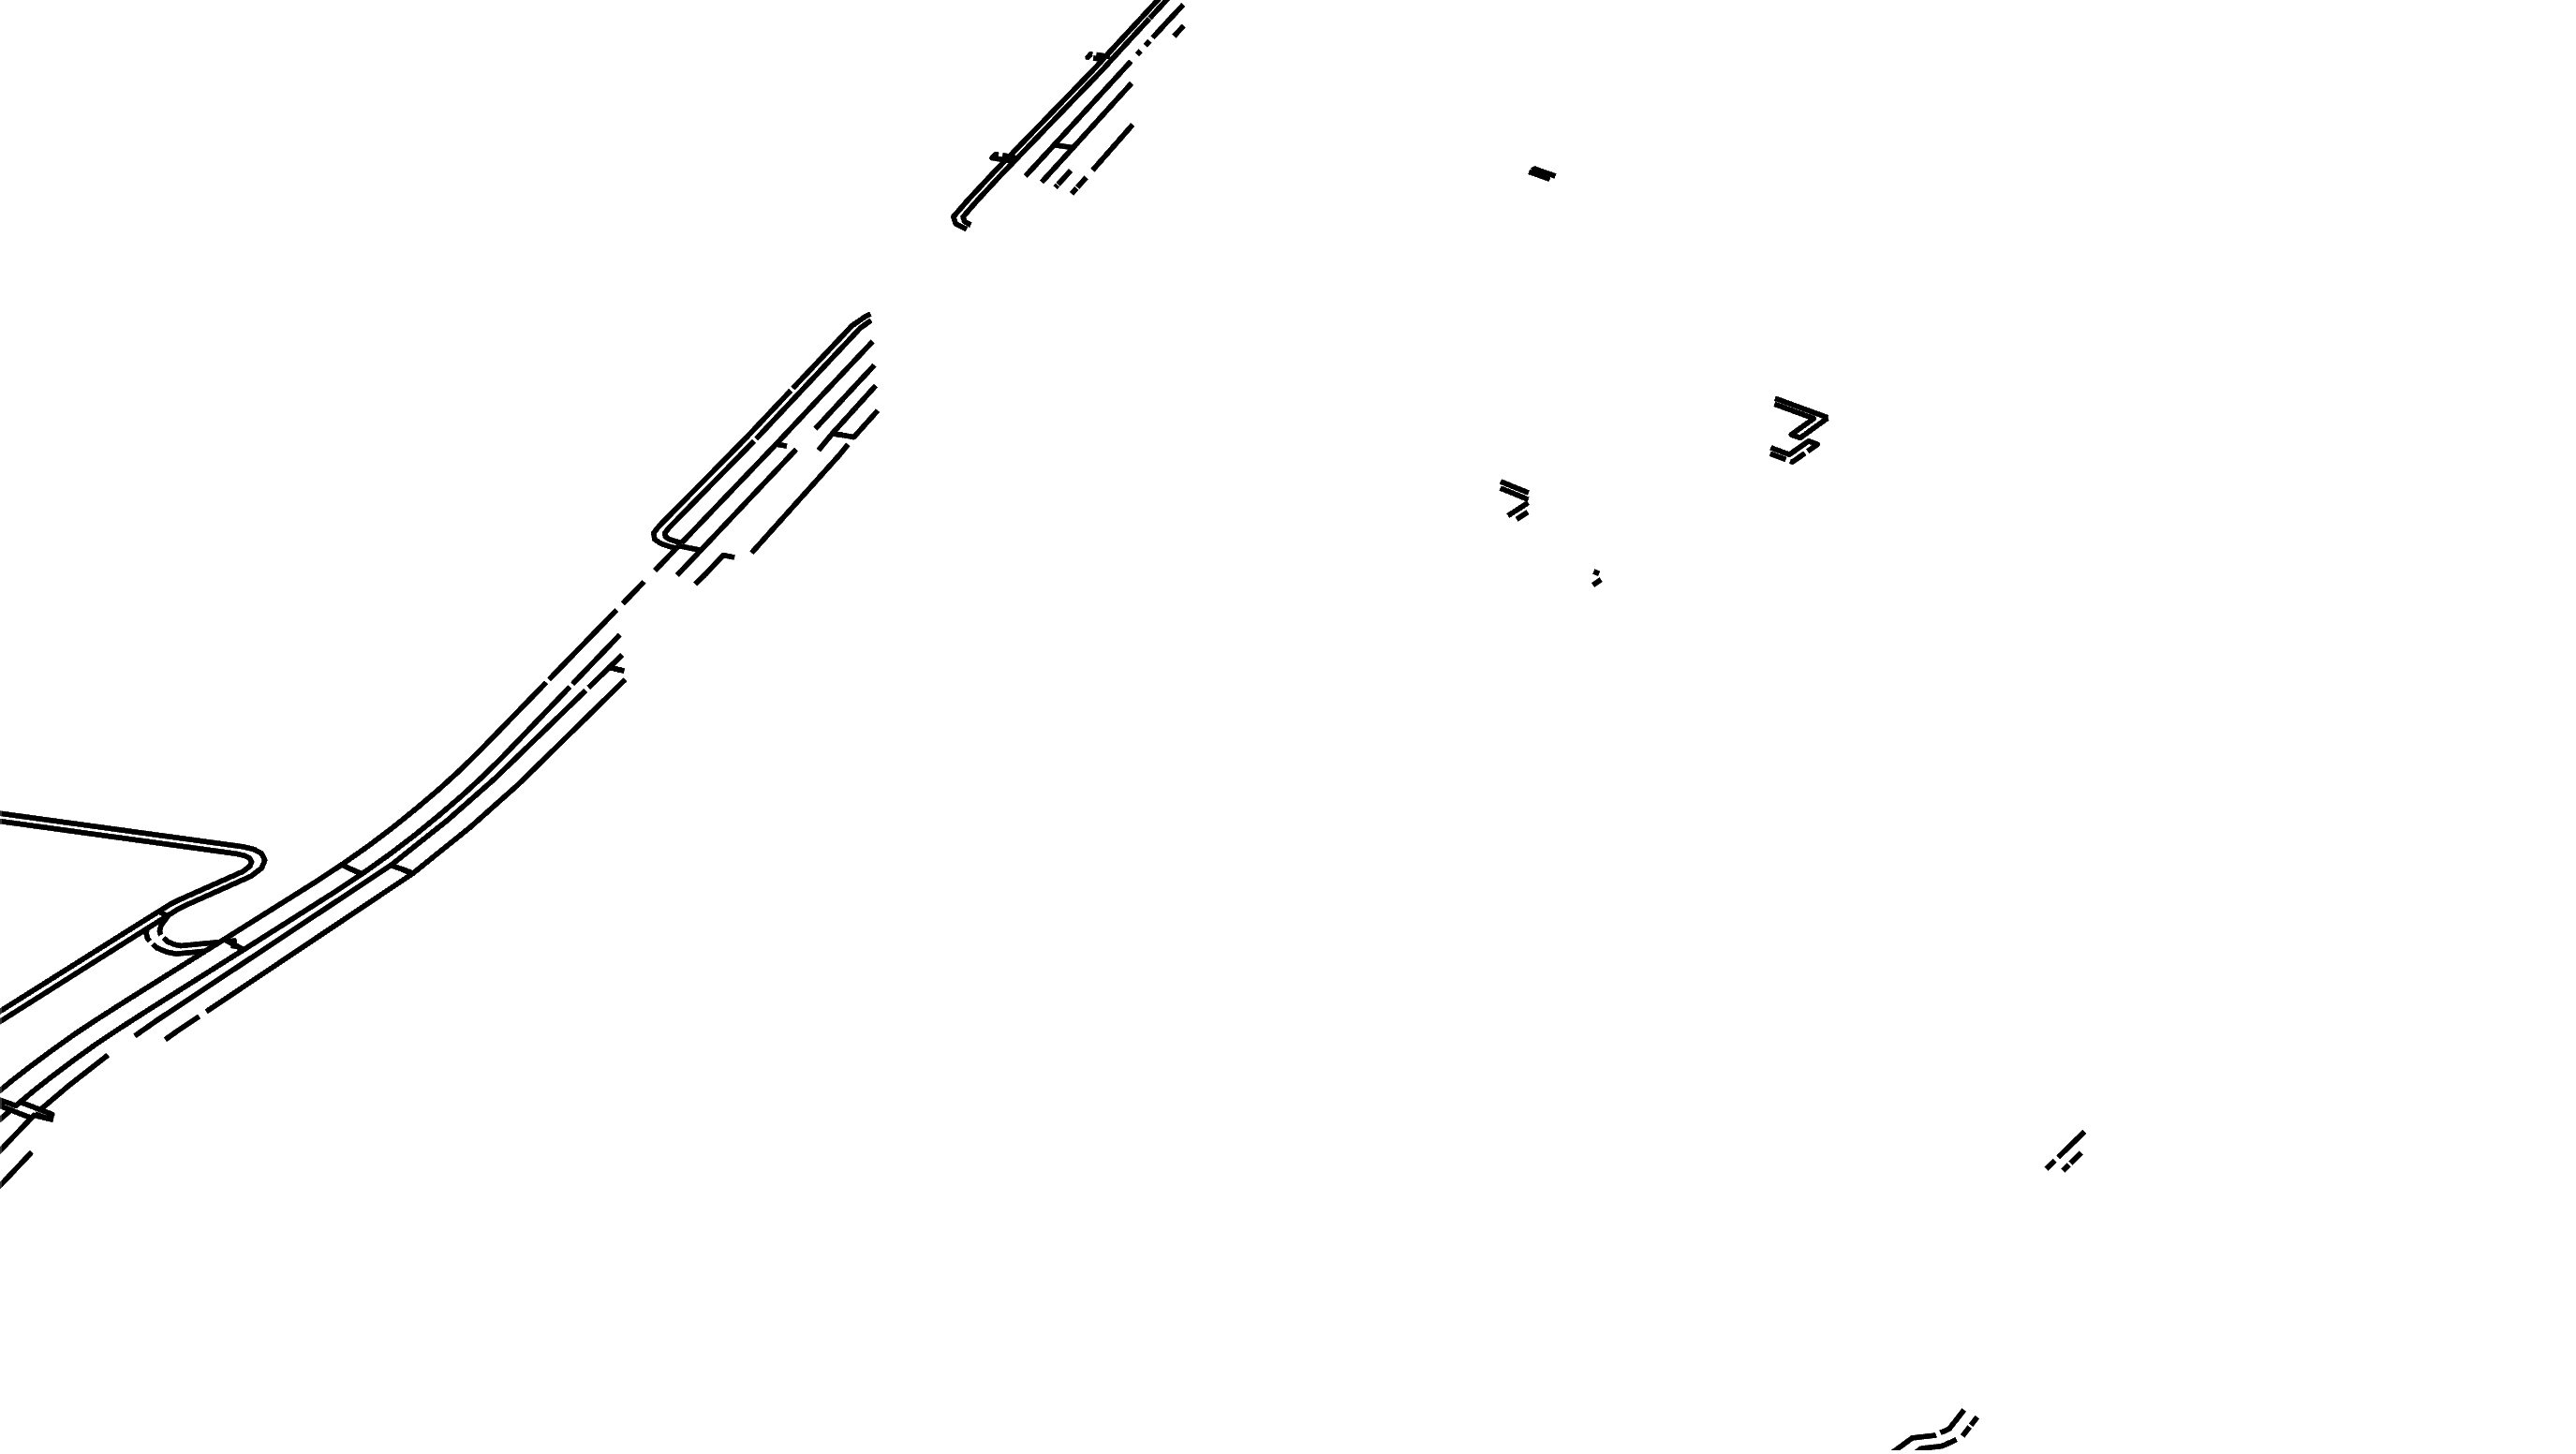
roads-only:
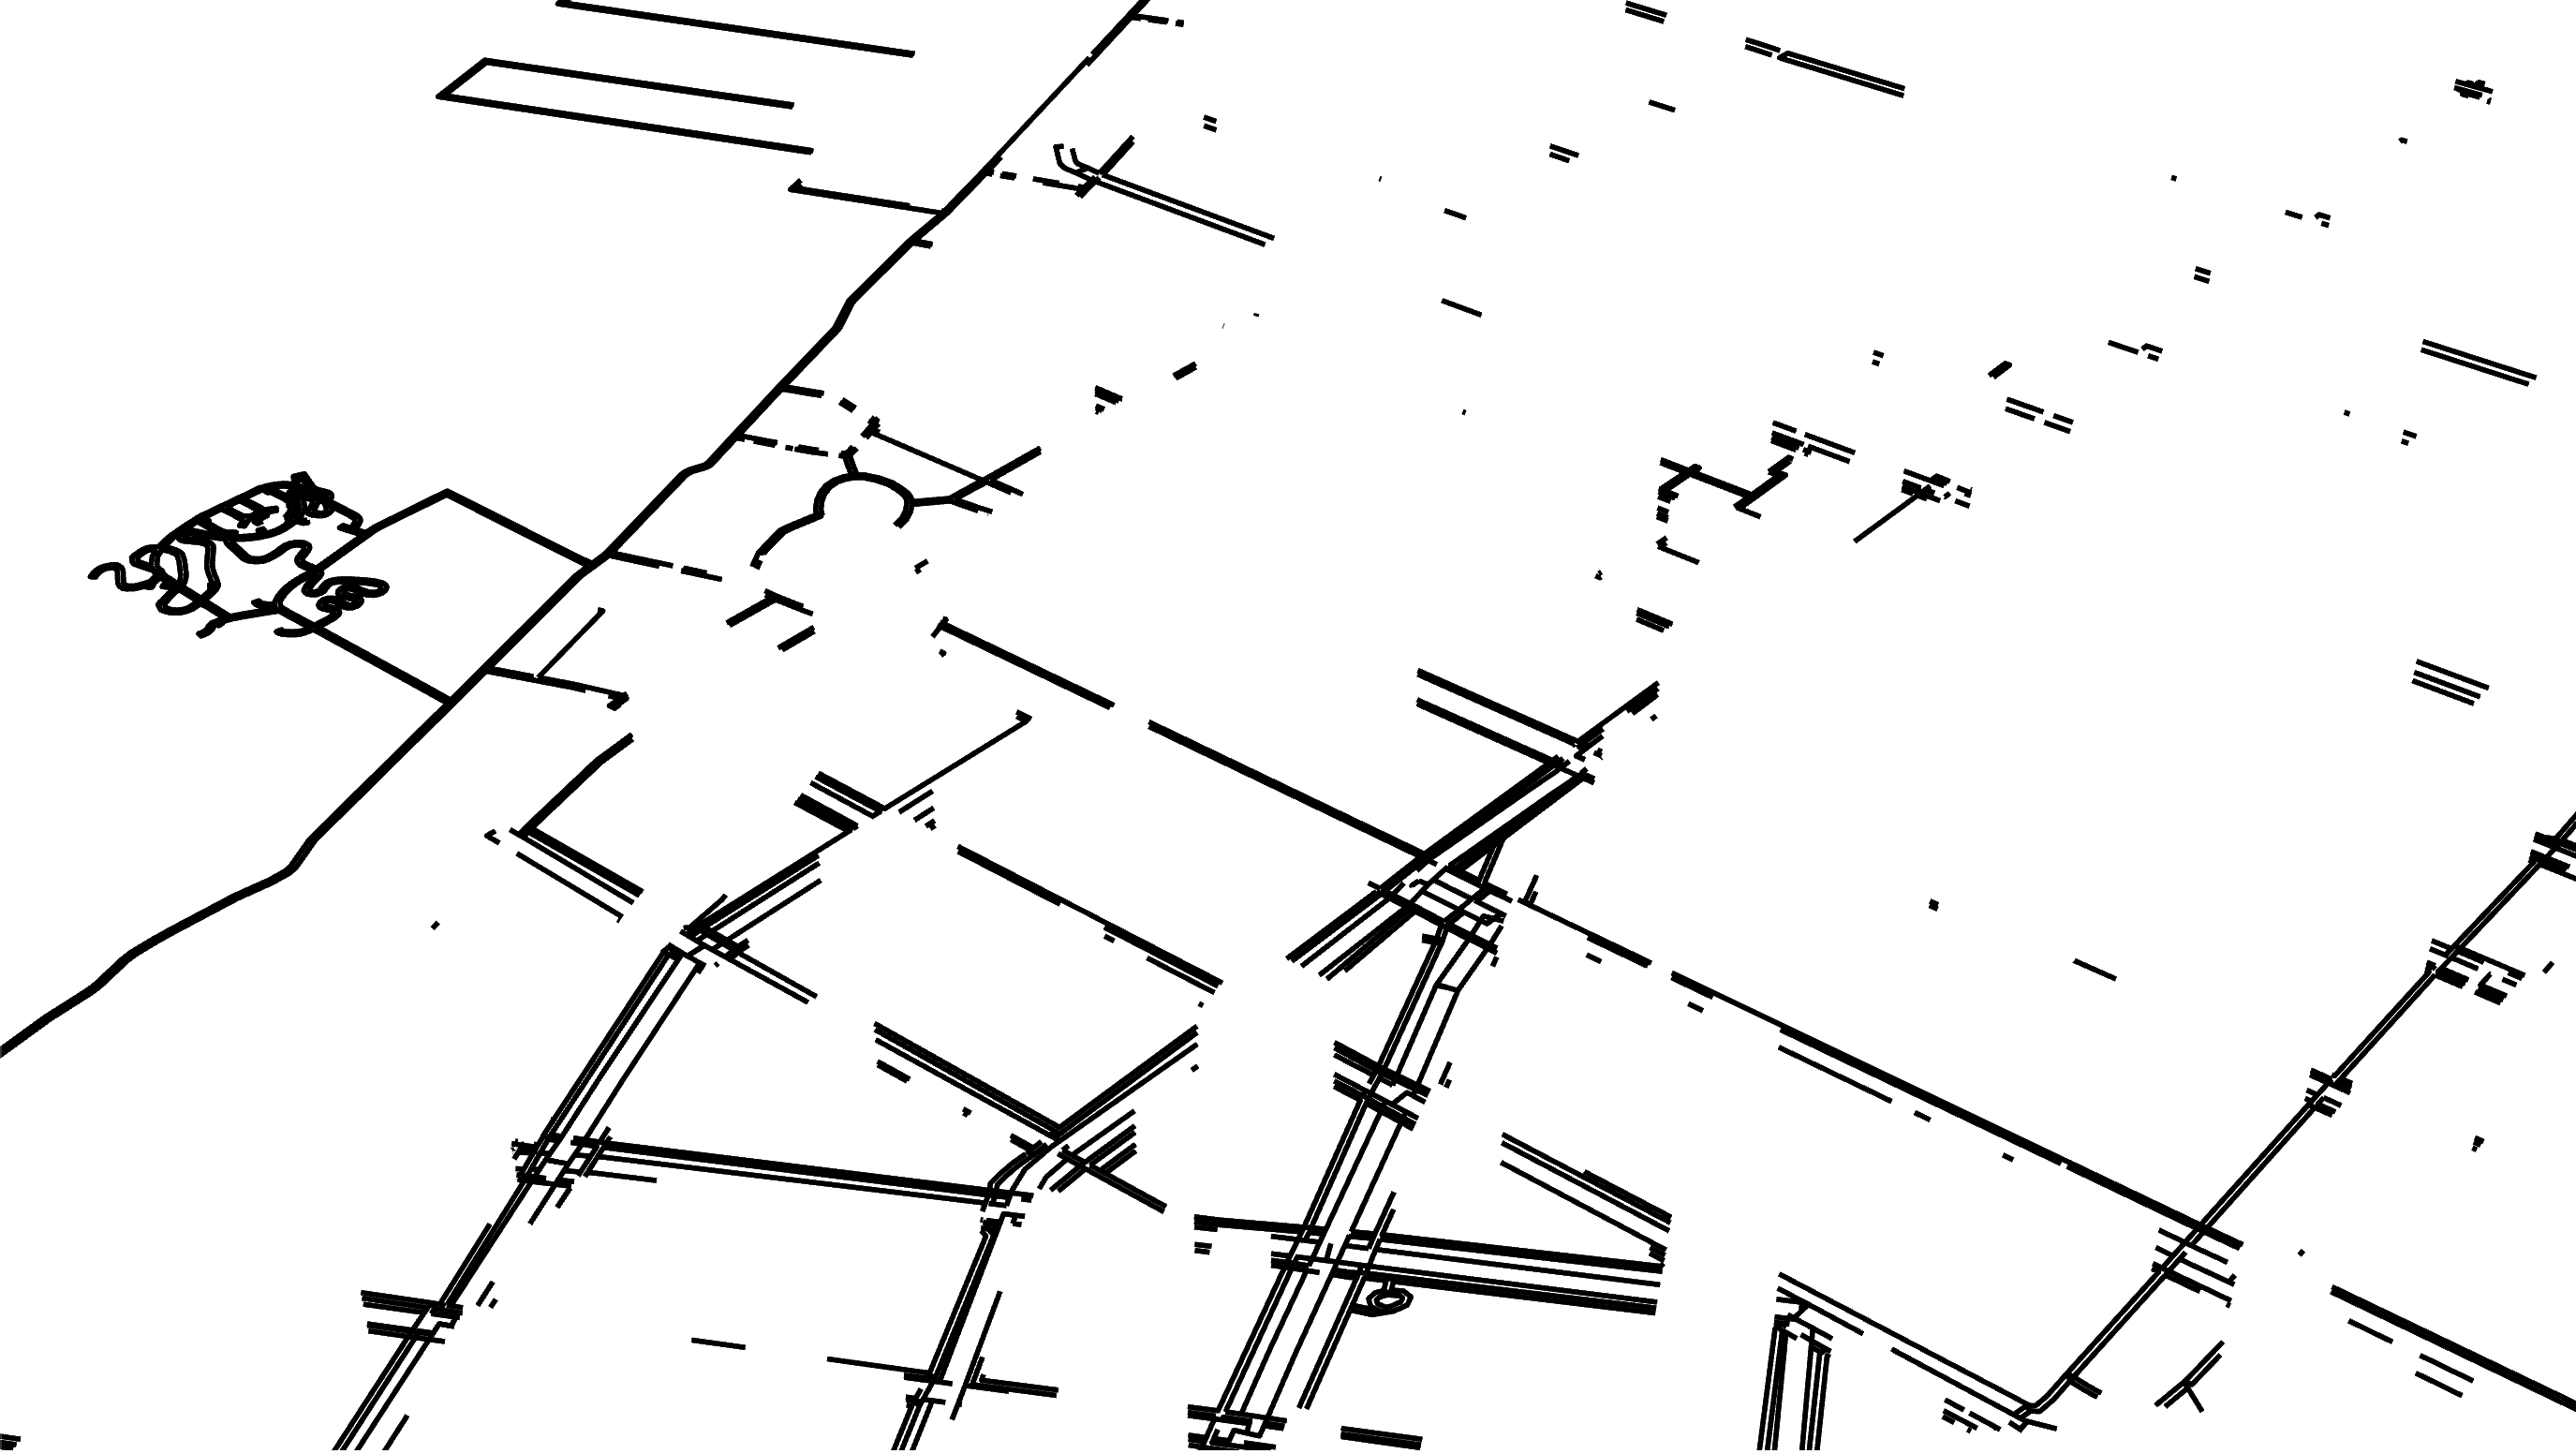
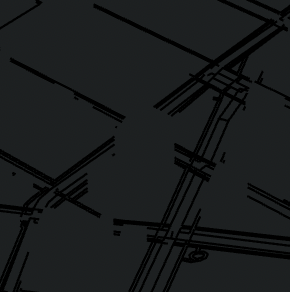
and highways-only:
Blender rendered these all in the same pass, so objects in the foreground correctly block objects in the background.
Foreground:
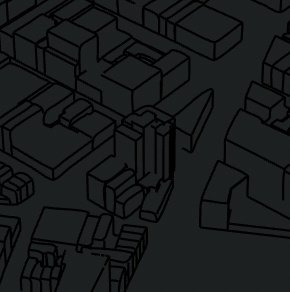
Background:
AxiDraw⌗
That’s pretty much it. We can send each layer to the plotter one at a time, swapping out pen colors, and we know that objects in the foreground will appear to obscure objects in the background. Here is the final product: